06-Spatial-Data-in-R
Understanding Spatial Data and basics of Maps in R
Arvind Venkatadri
03/July/2021
Let's get started
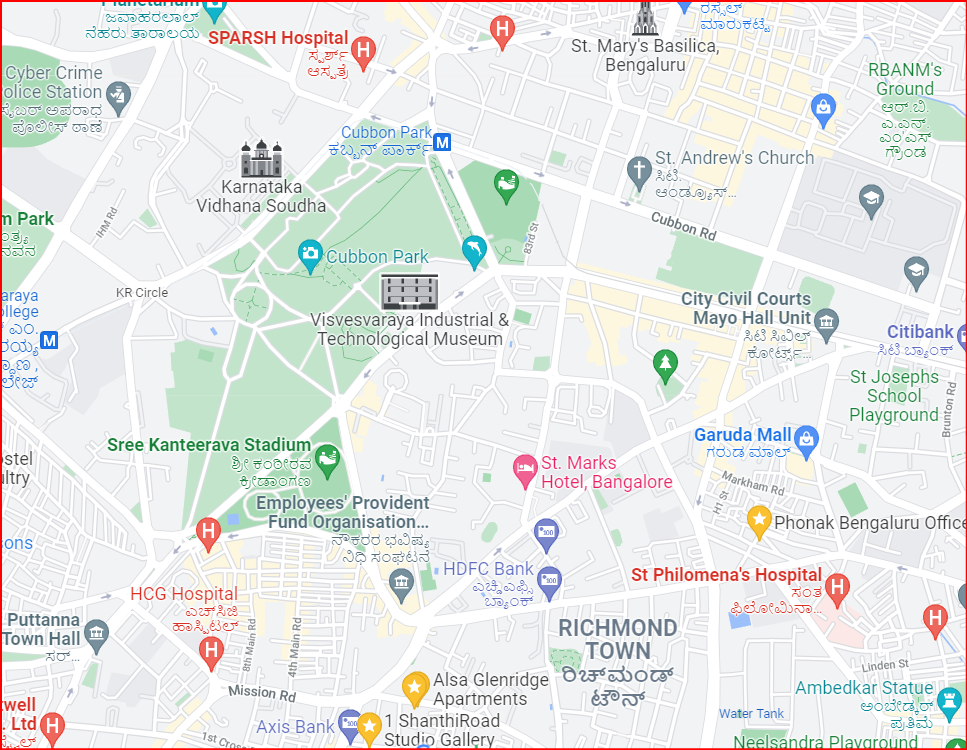
Look at a piece of Google Map.
What different objects do you see?
What information do you think went into making it?
Let's get started
To make maps, we need data organized in a specific way
Let us look at the pieces that go into making spatial data
Our focus will be the r package
sf( "simple features")
Data Structure in sf

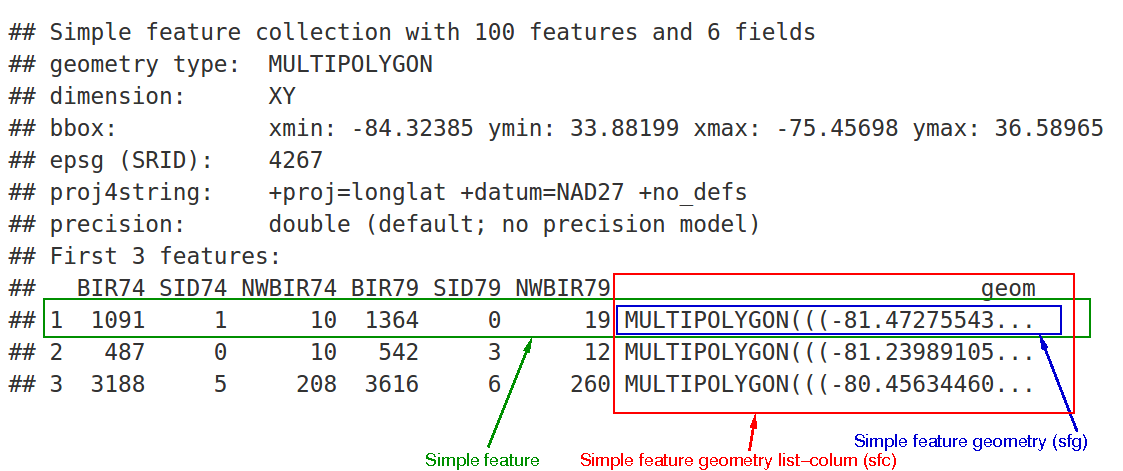
The picture shows a familiar looking data-frame with the far-right column containing geometries, or shapes....hmmm.
What is a Feature?
A Thing, or an Object in the real world
Examples of Features:
- A Tree or a Lamp-post
- A forest stand
- A city with building, streets, and parks
- A County or State
- A Country
- An Island

What is a Feature Geometry?
Features have a geometry describing where on Earth the feature is located
- Features = Shapes + Location Data
- The geometry of a tree can be the delineation of its crown ( Polygon )
- Of its stem, (Polygon )
- or the point indicating its centre. (Point )
- A feature geometry is called simple
- when it consists of points connected by straight line pieces,
- and does not intersect itself.
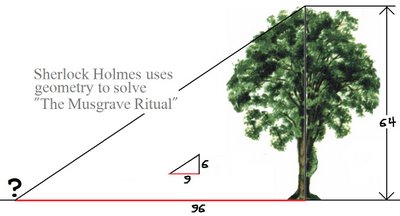
'Whose was it?'
'His who is gone.'
'Who shall have it?'
'He who will come.'
('What was the month?'
'The sixth from the first.')
'Where was the sun?'
'Over the oak.'
'Where was the shadow?'
'Under the elm.'
'How was it stepped?'
'North by ten and by ten, east by five and by five, south by two and by two, west by one and by one, and so under.'
'What shall we give for it?'
'All that is ours.'
'Why should we give it?'
'For the sake of the trust.'
So Finally, What is a Spatial Data Frame in R?
- Features Geometries + Attribute data in a single Data Frame
- Geometries give where the feature is located and its shape
- Attributes describe other properties:
- Tree height
- Flower or foliage colour
- Trunk diameter at breast height at a particular date,
- Tree species and so on.

Kinds of Geospatial Data
- Examples:
- Point: buildings, offices, venues, etc in a city
- LineString: Roads, rivers and railways
- Polygon: a lake, a golf course, or the border of a country
- MultiPolygon: Any non-contiguous set of areas, a set of suburbs for example
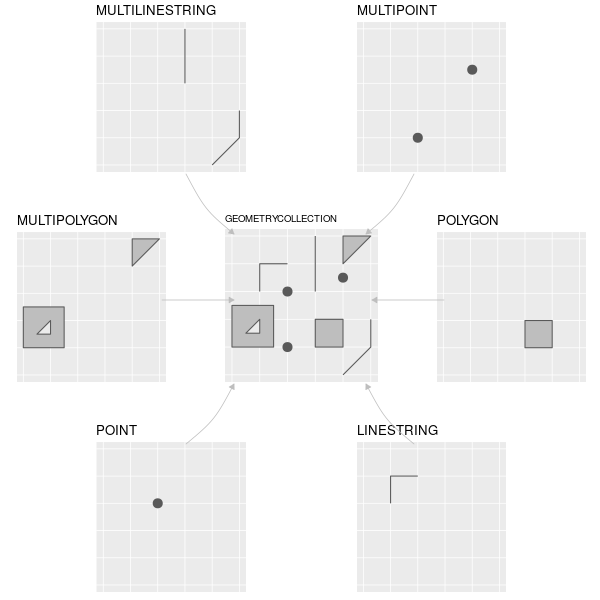
How are these shapes represented?
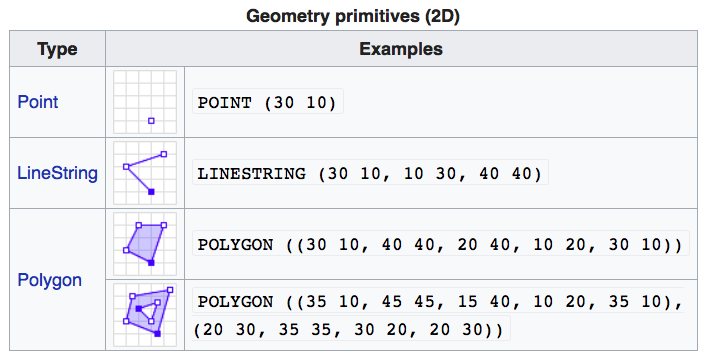
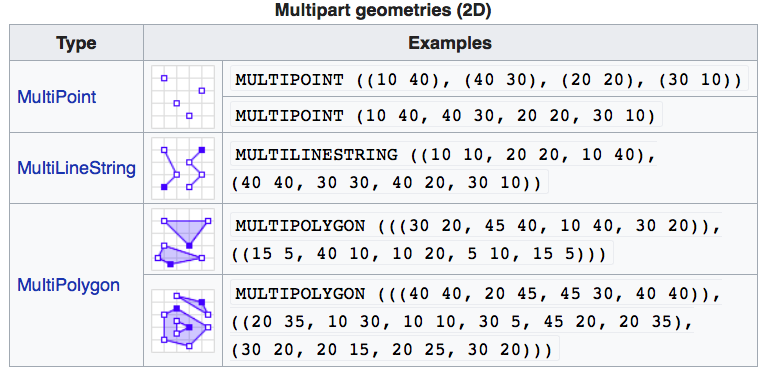
These formulaic descriptions are called WKT: Well Known Text
Note: Polygons can have "holes" in them!!
How are these shapes represented?
Let's read a spatial file available with sf:
nc <- sf::st_read(system.file("shape/nc.shp", package="sf"))Reading layer `nc' from data source `C:\Users\Arvind\R_library\sf\shape\nc.shp' using driver `ESRI Shapefile'Simple feature collection with 100 features and 14 fieldsGeometry type: MULTIPOLYGONDimension: XYBounding box: xmin: -84.32385 ymin: 33.88199 xmax: -75.45698 ymax: 36.58965Geodetic CRS: NAD27How are these shapes represented?
print(nc[9:15], n = 3)Simple feature collection with 100 features and 6 fieldsGeometry type: MULTIPOLYGONDimension: XYBounding box: xmin: -84.32385 ymin: 33.88199 xmax: -75.45698 ymax: 36.58965Geodetic CRS: NAD27First 3 features: BIR74 SID74 NWBIR74 BIR79 SID79 NWBIR79 geometry1 1091 1 10 1364 0 19 MULTIPOLYGON (((-81.47276 3...2 487 0 10 542 3 12 MULTIPOLYGON (((-81.23989 3...3 3188 5 208 3616 6 260 MULTIPOLYGON (((-80.45634 3...How are these shapes represented?
If we examine a spatial data fram in sf we get:
Let us plot some hand-crafted simple geometries
The sf : Spatial Data Frame: Point Geometry
# Let's get the India Boundarydata("World")india <- World %>% filter(iso_a3 == "IND")crs_india <- st_crs(india)points <- # Create 5 random points data.frame(lon = rnorm(5, 77, 2), lat = rnorm(5, 23, 5))str(points)'data.frame': 5 obs. of 2 variables: $ lon: num 72.7 77.5 73.5 77.8 77.3 $ lat: num 27.6 21.4 24.6 24.7 20.2The sf : Spatial Data Frame: Point Geometry
# Let's get the India Boundarydata("world")india <- World %>% filter(iso_a3 == "IND")crs_india <- st_crs(india)points <- # Create 5 random points data.frame(lon = rnorm(5, 77, 2), lat = rnorm(5, 23, 5))str(points) # Convert to spatial data framepoints_sf <- st_as_sf(points, coords = c("lon", "lat"), crs = crs_india) str(points_sf)'data.frame': 5 obs. of 2 variables: $ lon: num 77.3 71.5 73.7 72 79.2 $ lat: num 21.4 23.1 21.6 23.2 25.7Classes 'sf' and 'data.frame': 5 obs. of 1 variable: $ geometry:sfc_POINT of length 5; first list element: 'XY' num 77.3 21.4 - attr(*, "sf_column")= chr "geometry" - attr(*, "agr")= Factor w/ 3 levels "constant","aggregate",..: ..- attr(*, "names")= chr(0)The sf : Spatial Data Frame: Point Geometry
# Let's get the India Boundarydata("world")india <- World %>% filter(iso_a3 == "IND")crs_india <- st_crs(india)points <- # Create 5 random points data.frame(lon = rnorm(5, 77, 2), lat = rnorm(5, 23, 5))#str(points) # Convert to spatial data framepoints_sf <- st_as_sf(points, coords = c("lon", "lat"), crs = crs_india)#str(points_sf)ggplot() + geom_sf(data = india) + geom_sf(data = points_sf, colour = "red", size = 4)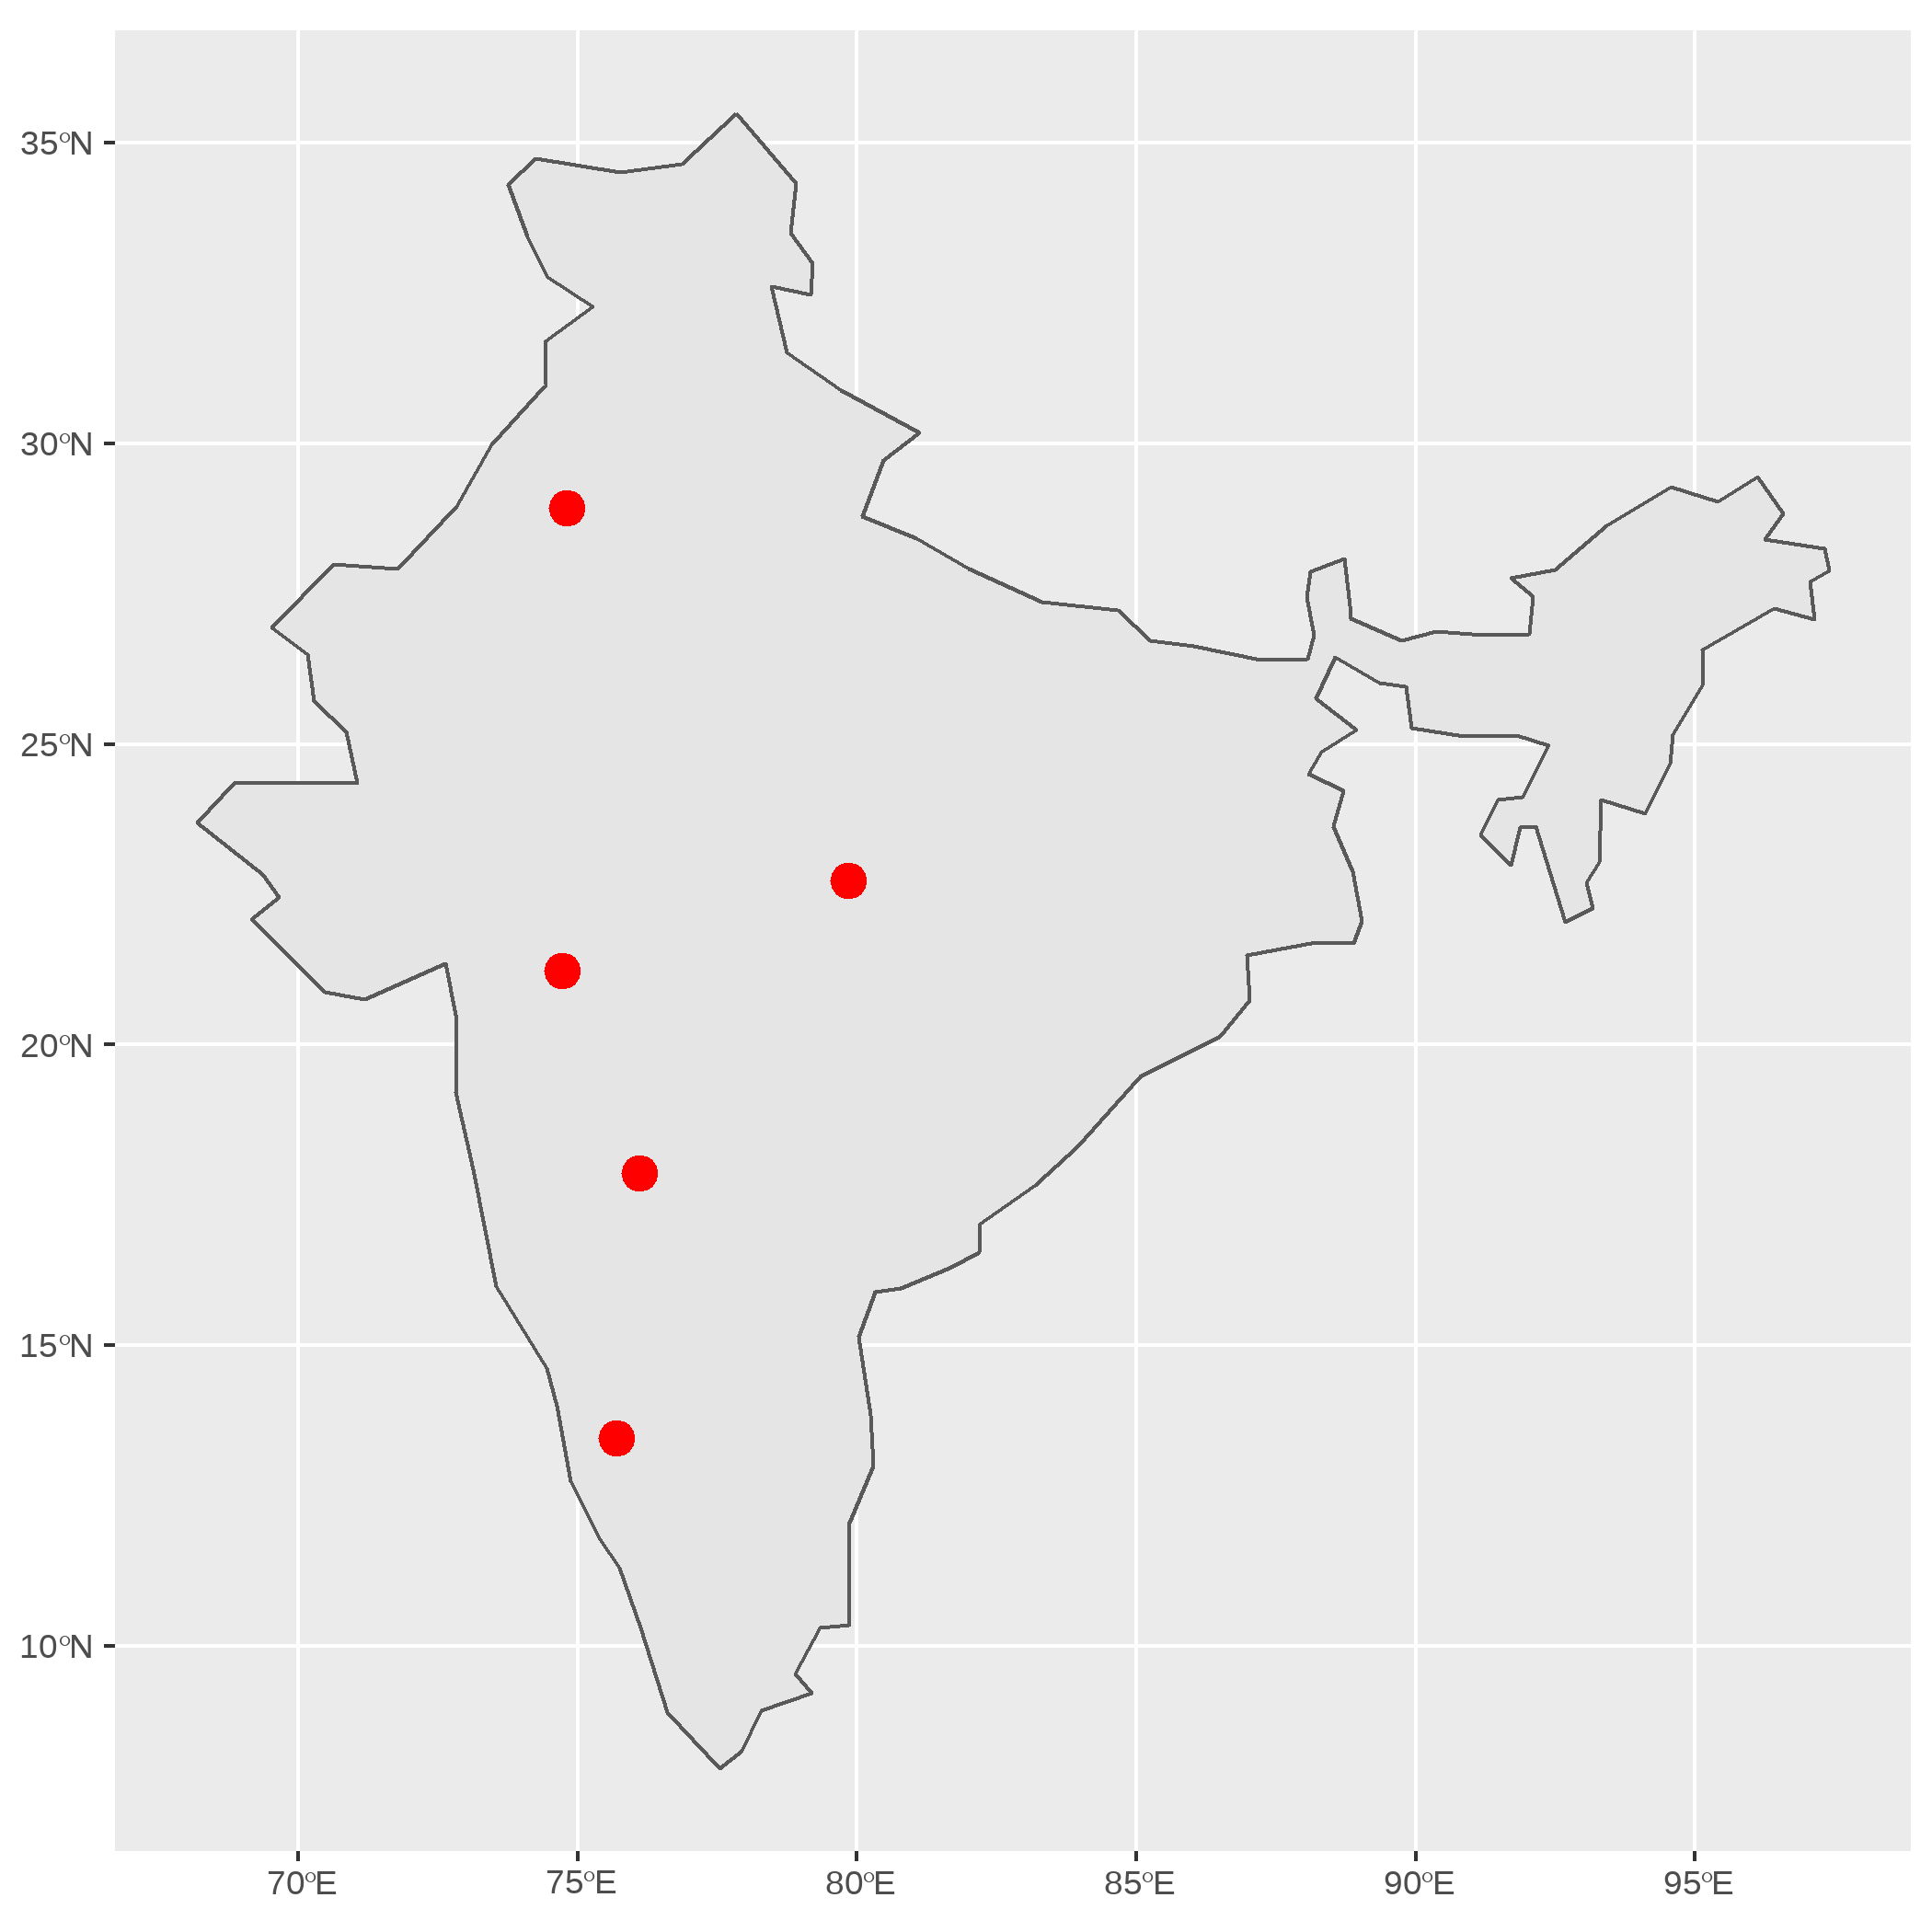
Let's now plot a handcrafted Polygon Geometry
The sf:Spatial Data Frame: Polygon Geometry
# Let's create three SQUARES# (Using matrices)# Center them over Central India # (Lon: 77, Lat: 13)# outer <- matrix(c(0,0,10,0,10,10,0,10,0,0) + c(77,13), ncol=2, byrow=TRUE)hole1 <- matrix(c(1,1,1,2,2,2,2,1,1,1) + c(77,13),ncol=2, byrow=TRUE)hole2 <- matrix(c(5,5,5,6,6,6,6,5,5,5) + c(77,13),ncol=2, byrow=TRUE)outer# Now pile all matrices into a **LIST*# pl1 <- list(outer, hole1, hole2)str(pl1) [,1] [,2][1,] 77 13[2,] 87 13[3,] 87 23[4,] 77 23[5,] 77 13List of 3 $ : num [1:5, 1:2] 77 87 87 77 77 13 13 23 23 13 $ : num [1:5, 1:2] 78 78 79 79 78 14 15 15 14 14 $ : num [1:5, 1:2] 82 82 83 83 82 18 19 19 18 18NAThe sf:Spatial Data Frame: Polygon Geometry
# Let's create three SQUARES# (Using matrices)# Center them over Central India # (Lon: 77, Lat: 13)# outer <- matrix(c(0,0,10,0,10,10,0,10,0,0) + c(77,13), ncol=2, byrow=TRUE)hole1 <- matrix(c(1,1,1,2,2,2,2,1,1,1) + c(77,13),ncol=2, byrow=TRUE)hole2 <- matrix(c(5,5,5,6,6,6,6,5,5,5) + c(77,13),ncol=2, byrow=TRUE)outer# Now pile all matrices into a **LIST*# pl1 <- list(outer, hole1, hole2)str(pl1) [,1] [,2][1,] 77 13[2,] 87 13[3,] 87 23[4,] 77 23[5,] 77 13List of 3 $ : num [1:5, 1:2] 77 87 87 77 77 13 13 23 23 13 $ : num [1:5, 1:2] 78 78 79 79 78 14 15 15 14 14 $ : num [1:5, 1:2] 82 82 83 83 82 18 19 19 18 18The sf:Spatial Data Frame: Polygon Geometry
# Let's create three SQUARES# (Using matrices)# Center them over Central India # (Lon: 77, Lat: 13)# outer <- matrix(c(0,0,10,0,10,10,0,10,0,0) + c(77,13), ncol=2, byrow=TRUE)hole1 <- matrix(c(1,1,1,2,2,2,2,1,1,1) + c(77,13),ncol=2, byrow=TRUE)hole2 <- matrix(c(5,5,5,6,6,6,6,5,5,5) + c(77,13),ncol=2, byrow=TRUE)#outer# Now pile all matrices into a **LIST*# pl1 <- list(outer, hole1, hole2)#str(pl1)pl1_polygon <- st_polygon(pl1) %>% # feature geometry st_sfc() %>% # feature column st_as_sf(crs = crs_india) # spatial data framestr(pl1_polygon)Classes 'sf' and 'data.frame': 1 obs. of 1 variable: $ x:sfc_POLYGON of length 1; first list element: List of 3 ..$ : num [1:5, 1:2] 77 87 87 77 77 13 13 23 23 13 ..$ : num [1:5, 1:2] 78 78 79 79 78 14 15 15 14 14 ..$ : num [1:5, 1:2] 82 82 83 83 82 18 19 19 18 18 ..- attr(*, "class")= chr [1:3] "XY" "POLYGON" "sfg" - attr(*, "sf_column")= chr "x" - attr(*, "agr")= Factor w/ 3 levels "constant","aggregate",..: ..- attr(*, "names")= chr(0)The sf:Spatial Data Frame: Polygon Geometry
# Let's create three SQUARES# (Using matrices)# Center them over Central India # (Lon: 77, Lat: 13)# outer <- matrix(c(0,0,10,0,10,10,0,10,0,0) + c(77,13), ncol=2, byrow=TRUE)hole1 <- matrix(c(1,1,1,2,2,2,2,1,1,1) + c(77,13),ncol=2, byrow=TRUE)hole2 <- matrix(c(5,5,5,6,6,6,6,5,5,5) + c(77,13),ncol=2, byrow=TRUE)# Now pile all matrices into a **LIST*pl1 <- list(outer, hole1, hole2)pl1_polygon <- st_polygon(pl1) %>% # feature geometry st_sfc() %>% # feature column st_as_sf(crs = crs_india) # spatial data frameggplot() + geom_sf(data = india) + geom_sf(data = pl1_polygon, colour = "red")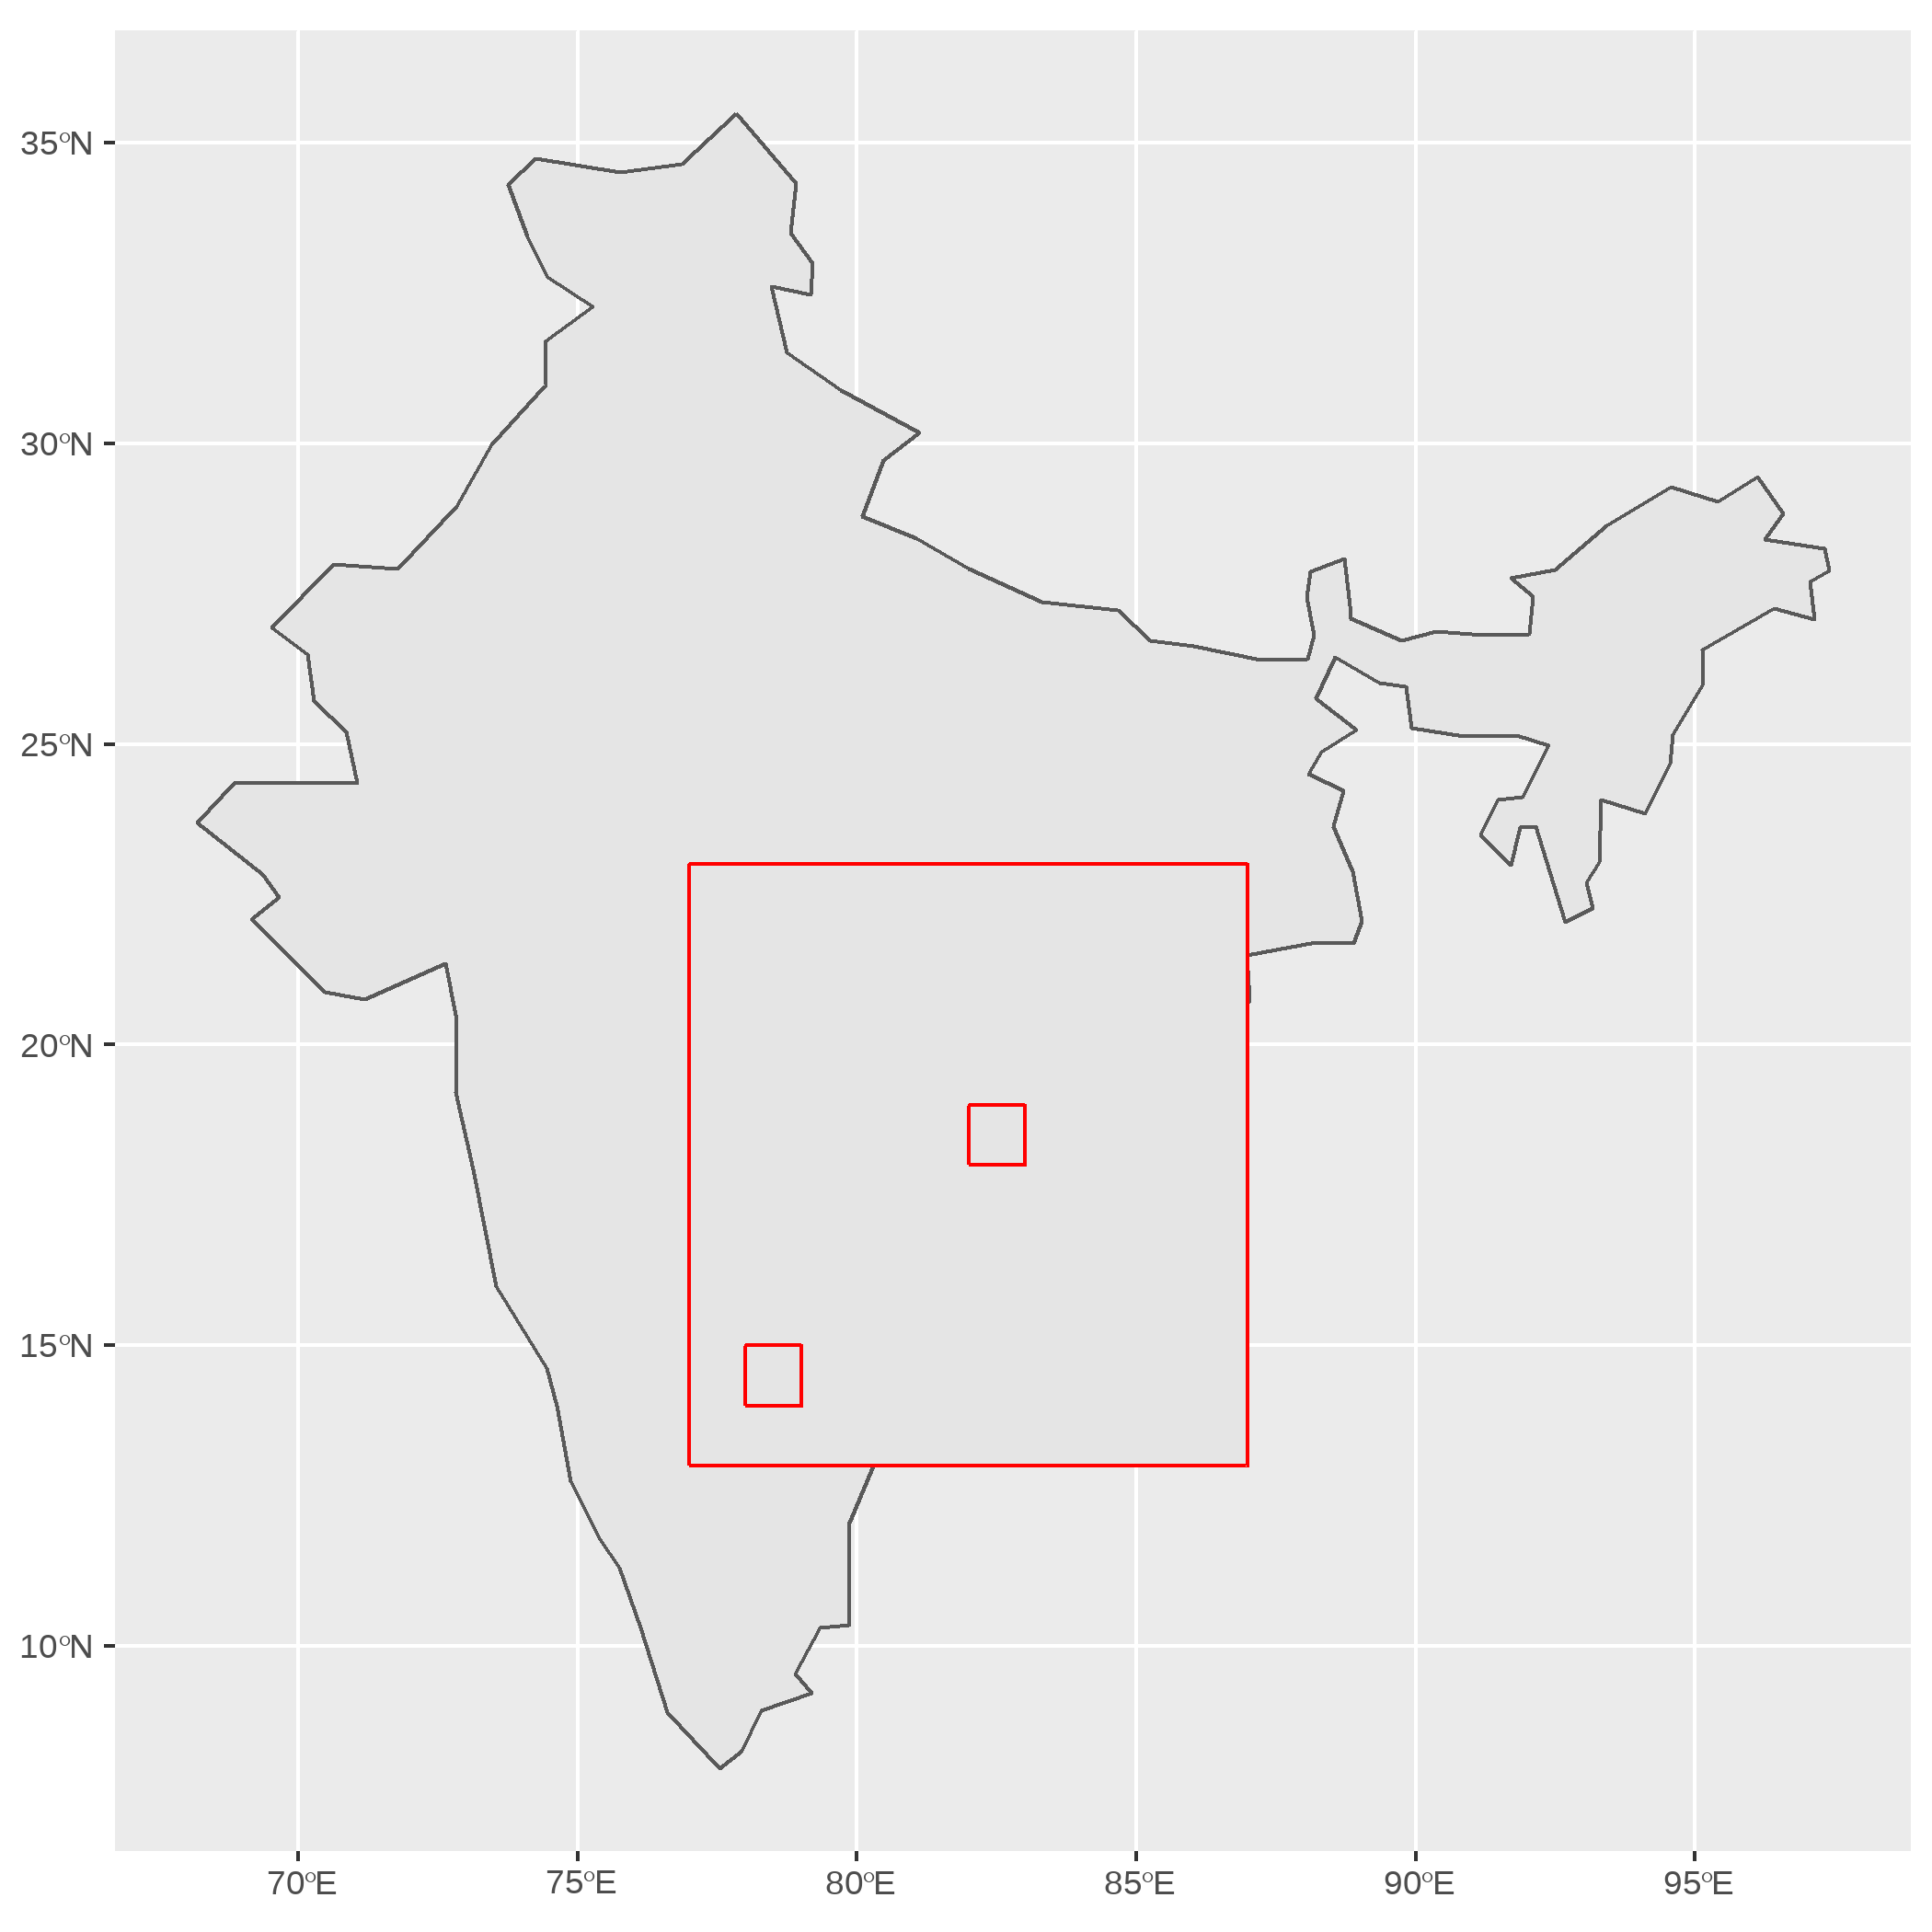
Let us (sigh) see a handcrafted Multi-Polygon
The sf:Spatial Data Frame: Multi-Polygon Geometry
pol1 <- list(outer, hole1, hole2)pol2 <- list(outer + 12, hole1 + 12)pol3 <- list(outer - 12)mp <- list(pol1,pol2,pol3)mp1 <- st_multipolygon(mp) %>% #feature geometry st_sfc() %>% #feature column st_as_sf(crs = crs_india) # sf dataframehead(mp1,3)ggplot() + geom_sf(data = india) + geom_sf(data = mp1, colour = "red")Simple feature collection with 1 feature and 0 fieldsGeometry type: MULTIPOLYGONDimension: XYBounding box: xmin: 65 ymin: 1 xmax: 99 ymax: 35Geodetic CRS: WGS 84 x1 MULTIPOLYGON (((77 13, 87 1...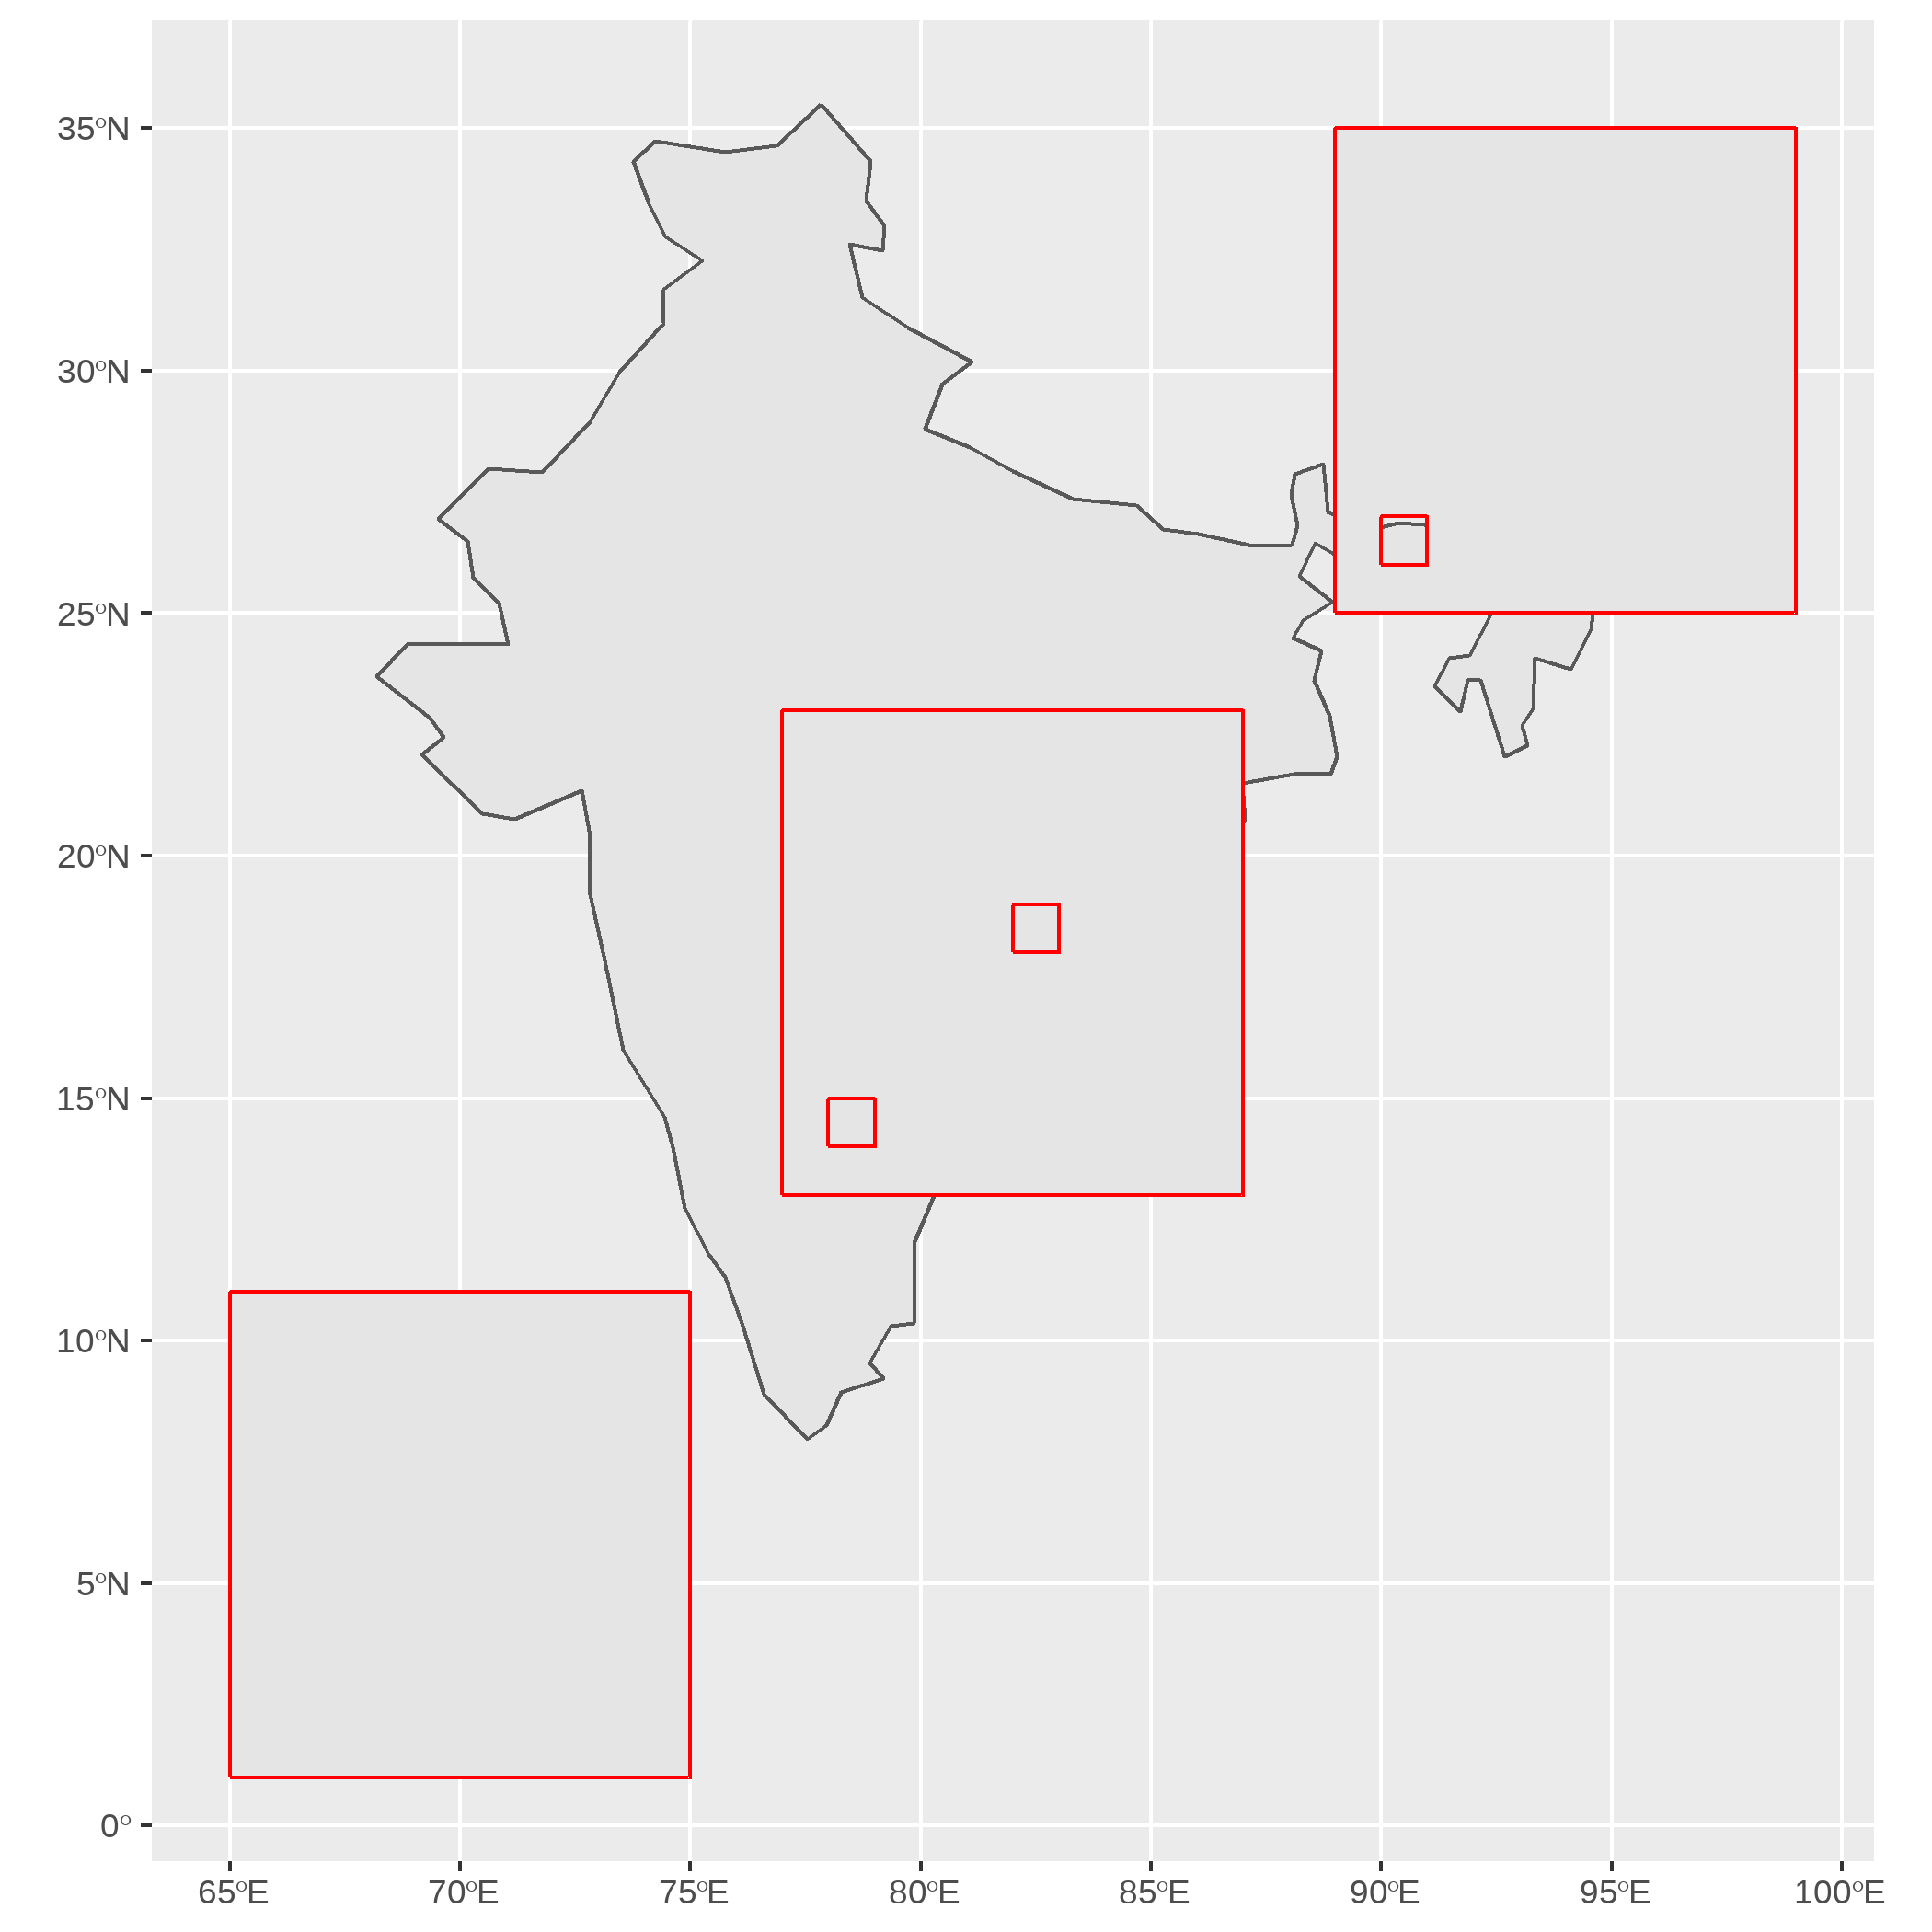
Image credit: alice-in-wonderland.net
Map Projections: Through the Looking Glass
A Projection is a shadow or Image...

We see Maps Through The Looking Glass...
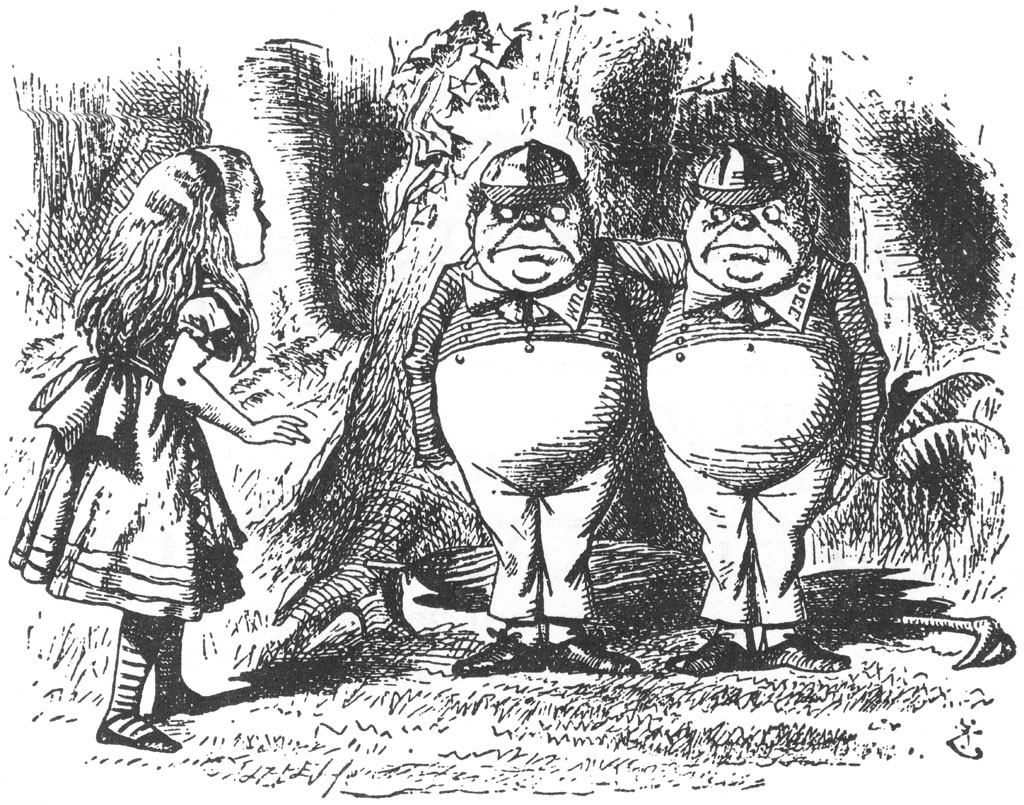
No Two Map Projections are Alike!
Why do we Need Projections?

- Cannot Flatten the Earth's Surface onto a 2D surface
- Just as we cannot flatten the Orange Peel
- So: we need Mirrors, Shadows and Images and Lights...just like Alice
How is a Projection Created?
Regular Cylindrical Projection
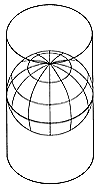
Oblique Cylindrical Projection
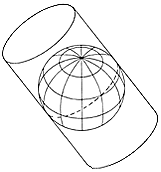
How is a Projection Created?
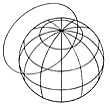
Polar Azimuthal Projection

Oblique Azimuthal Projection
Why does all this Matter??
The Gall-Peters Projection
From "The West Wing" Season 2 Episode 16.
Projections with coord_sf()
Let's create an Azimuthal Equal Area Projection in R. We can use the Lambert Azimuthal Equal-Area Projection:
ggplot() + geom_sf(data = world) + geom_sf(data = india) + geom_sf(data = points_sf, colour = "red", size = 4) + coord_sf(crs = "+proj=laea +lat_0=23 +lon_0=77 +x_0=4321000 #<< +y_0=3210000 +ellps=GRS80 +units=m +no_defs")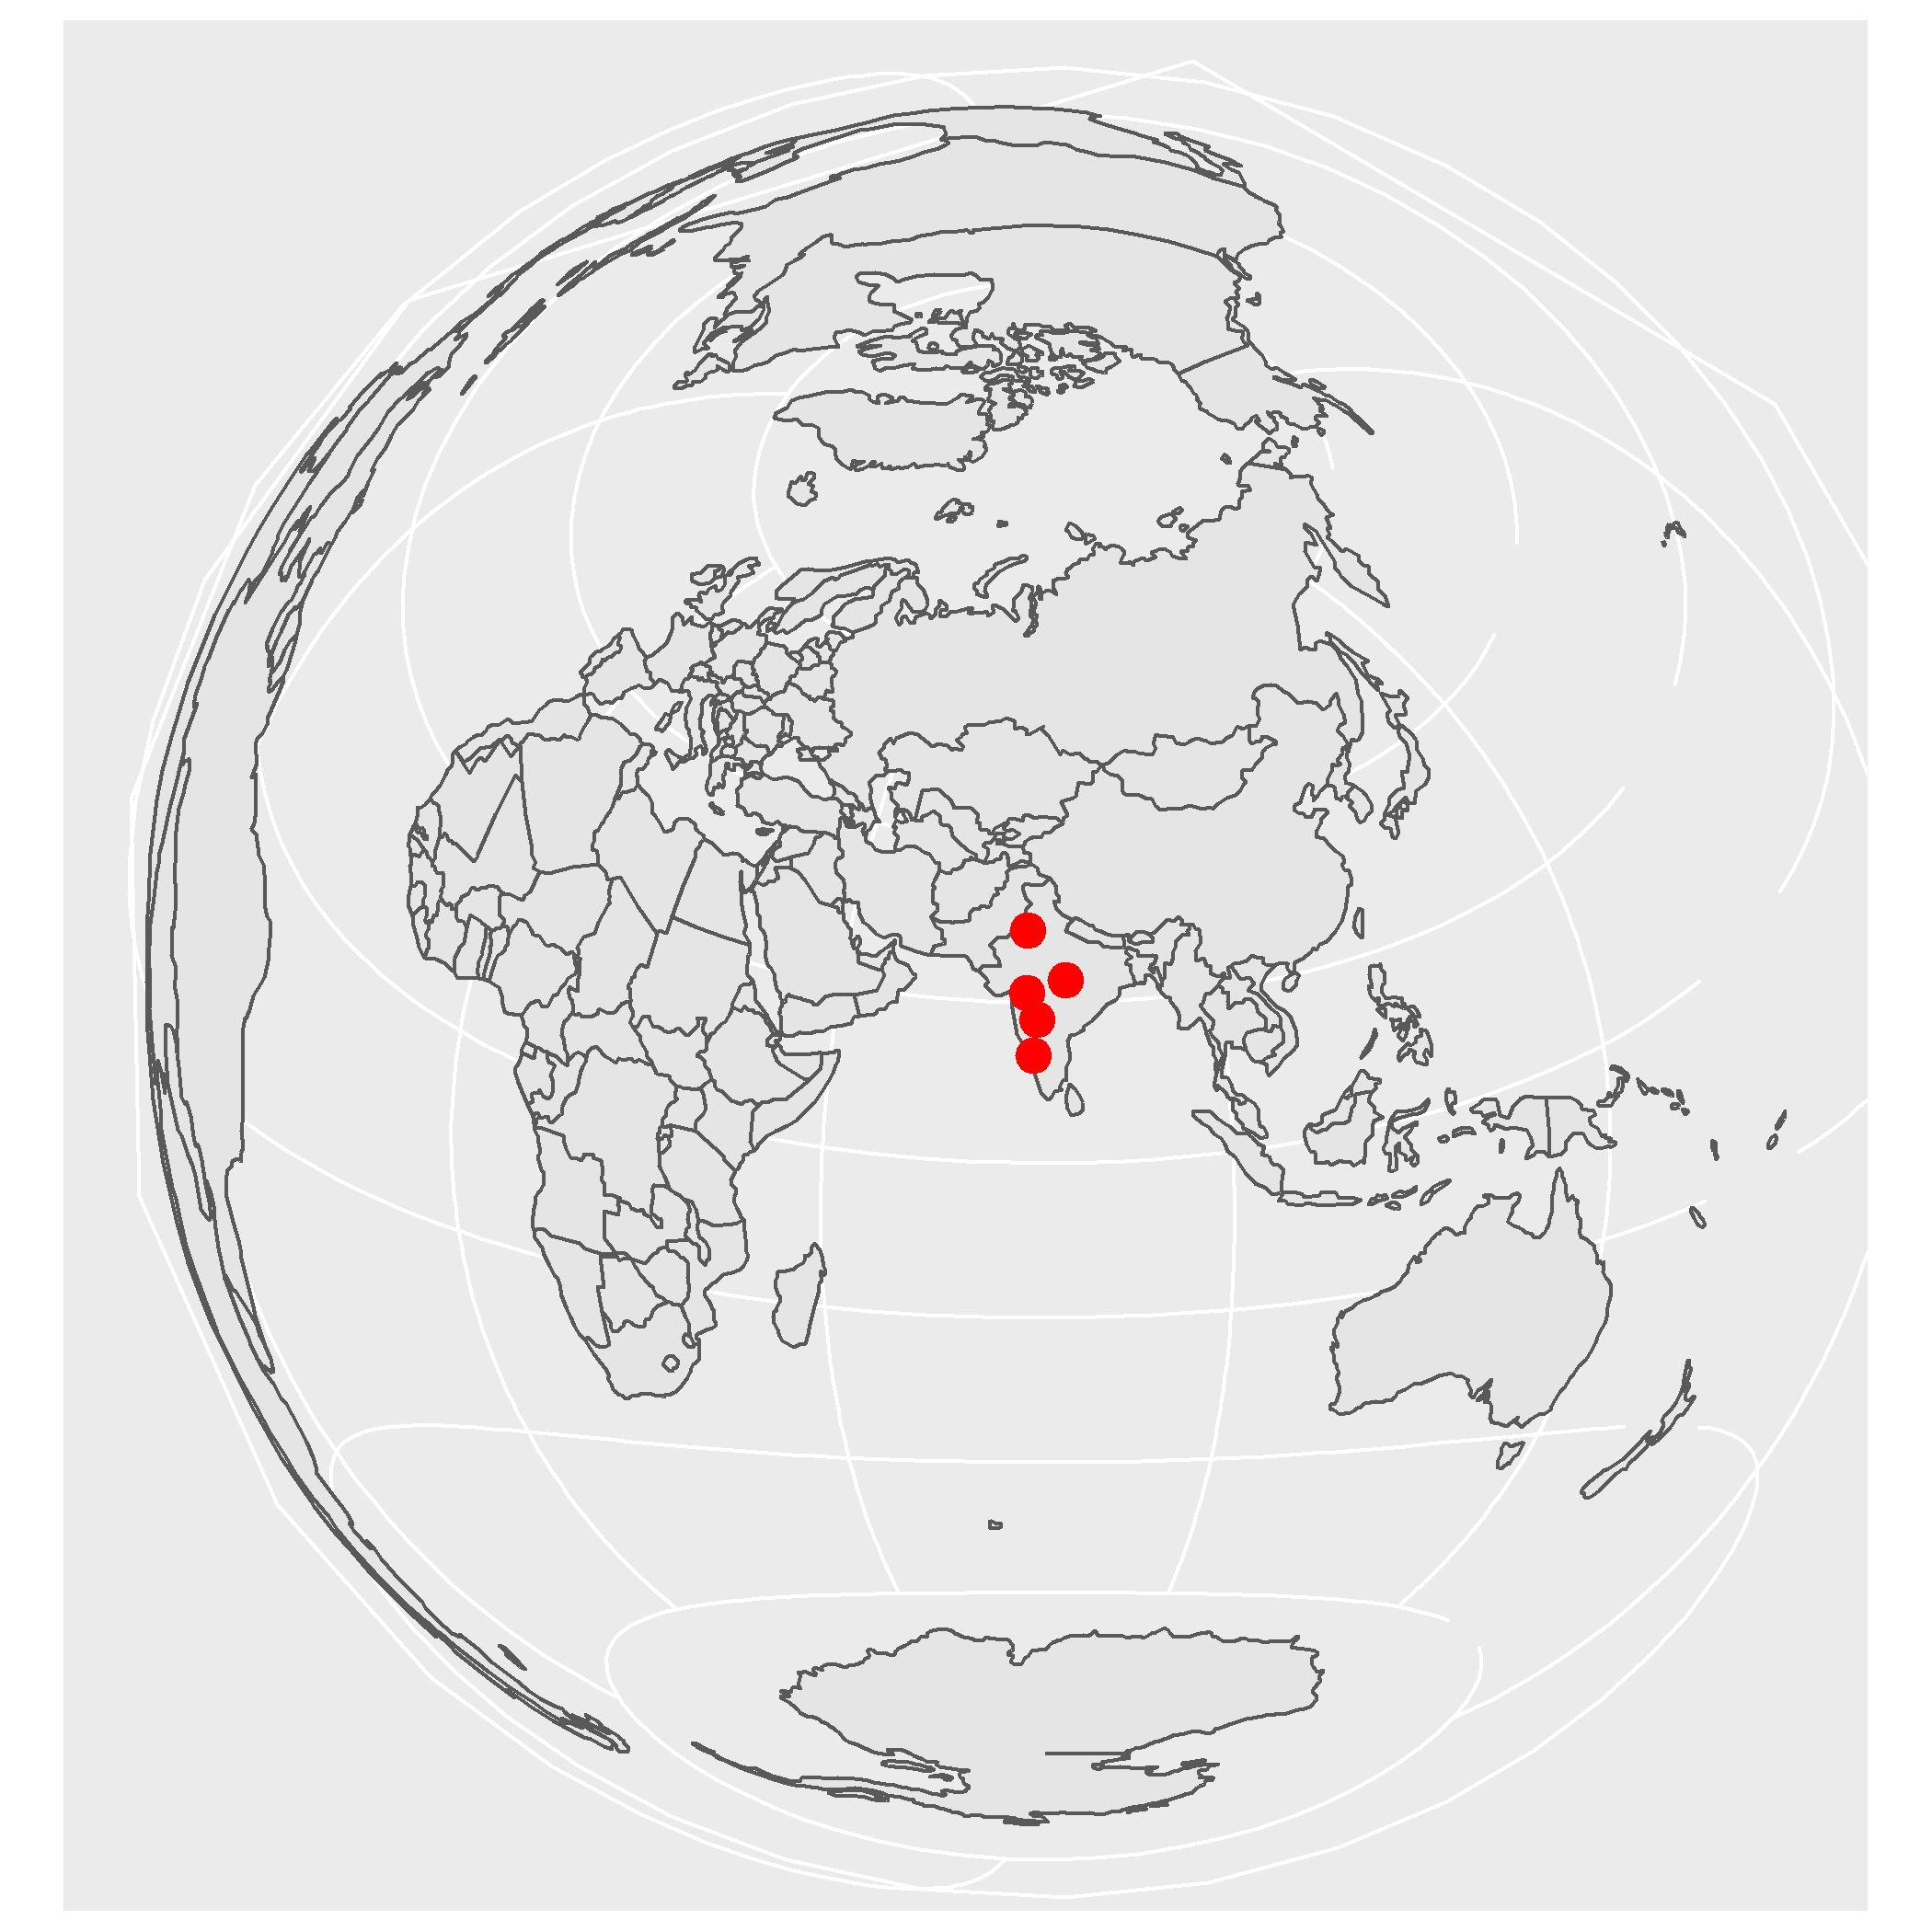
Why do we need Map Projections?
To Summarize
- We obtain Spatial Data Frames from many sources, which we will see
- We very rarely create small Spatial Data by hand-coding WKT
- We can process with the Spatial Data with
dplyrlike verbs, which we have not yet covered here
Now we will:
- Plot a variety of static and interactive maps
- Use Projections to show of the map in the right way
- We may need to re-project the data if it is not already in the projection we want
Map Making with tmap
Adapted from SIGR2021 Conference (Sciences de l'information géographique reproductibles)
Saint-Pierre-d'Oléron (France)
27/June/2021 to 3/July/2021
"GIS and mapping": "A workshop on GIS and mapping with R: part 2"
Jakub Nowosad & Robin Lovelace
Mapping
- We have seen a bit of
ggplot + geom_sf + coord_sf() - This is good for static plots
tmapcan give us both static and interactive plots- And some fancy map templates too!!
Mapping
Let's look at London Boroughs and places where we can hire bicycles.
data("lnd", package = "spData") # Boroughs of Londondata("cycle_hire_osm", package = "spData") # Cycle Hire locationsstr(lnd)Classes 'sf' and 'data.frame': 33 obs. of 8 variables: $ NAME : Factor w/ 33 levels "Barking and Dagenham",..: 21 8 5 18 9 16 17 15 4 2 ... $ GSS_CODE : Factor w/ 33 levels "E09000001","E09000002",..: 21 8 6 18 9 16 17 15 5 3 ... $ HECTARES : num 3726 8649 15013 5659 5554 ... $ NONLD_AREA: num 0 0 0 60.8 0 ... $ ONS_INNER : Factor w/ 2 levels "F","T": 1 1 1 1 1 1 1 1 1 1 ... $ SUB_2009 : Factor w/ 0 levels: NA NA NA NA NA NA NA NA NA NA ... $ SUB_2006 : Factor w/ 0 levels: NA NA NA NA NA NA NA NA NA NA ... $ geometry :sfc_MULTIPOLYGON of length 33; first list element: List of 1 ..$ :List of 1 .. ..$ : num [1:1271, 1:2] -0.331 -0.331 -0.331 -0.33 -0.33 ... ..- attr(*, "class")= chr [1:3] "XY" "MULTIPOLYGON" "sfg" - attr(*, "sf_column")= chr "geometry" - attr(*, "agr")= Factor w/ 3 levels "constant","aggregate",..: NA NA NA NA NA NA NA ..- attr(*, "names")= chr [1:7] "NAME" "GSS_CODE" "HECTARES" "NONLD_AREA" ...Mapping
str(cycle_hire_osm)Classes 'sf' and 'data.frame': 540 obs. of 6 variables: $ osm_id : Factor w/ 540 levels "1010857552","1012775602",..: 8 228 229 230 231 232 233 234 235 236 ... $ name : Factor w/ 445 levels "Abbey Orchard Street",..: 440 298 71 NA NA 128 244 67 138 100 ... $ capacity : num 14 NA 11 NA NA NA NA 20 6 17 ... $ cyclestreets_id: Factor w/ 1 level "26743": NA NA NA NA NA NA NA NA NA NA ... $ description : Factor w/ 1 level "Barclays Cycle Hire": NA NA NA NA NA NA NA NA NA NA ... $ geometry :sfc_POINT of length 540; first list element: 'XY' num -0.0934 51.5291 - attr(*, "sf_column")= chr "geometry" - attr(*, "agr")= Factor w/ 3 levels "constant","aggregate",..: NA NA NA NA NA ..- attr(*, "names")= chr [1:5] "osm_id" "name" "capacity" "cyclestreets_id" ...Mapping
tm_shape(lnd) + tm_borders(col = "black", lwd = 1) + tm_fill("NAME", legend.show = FALSE)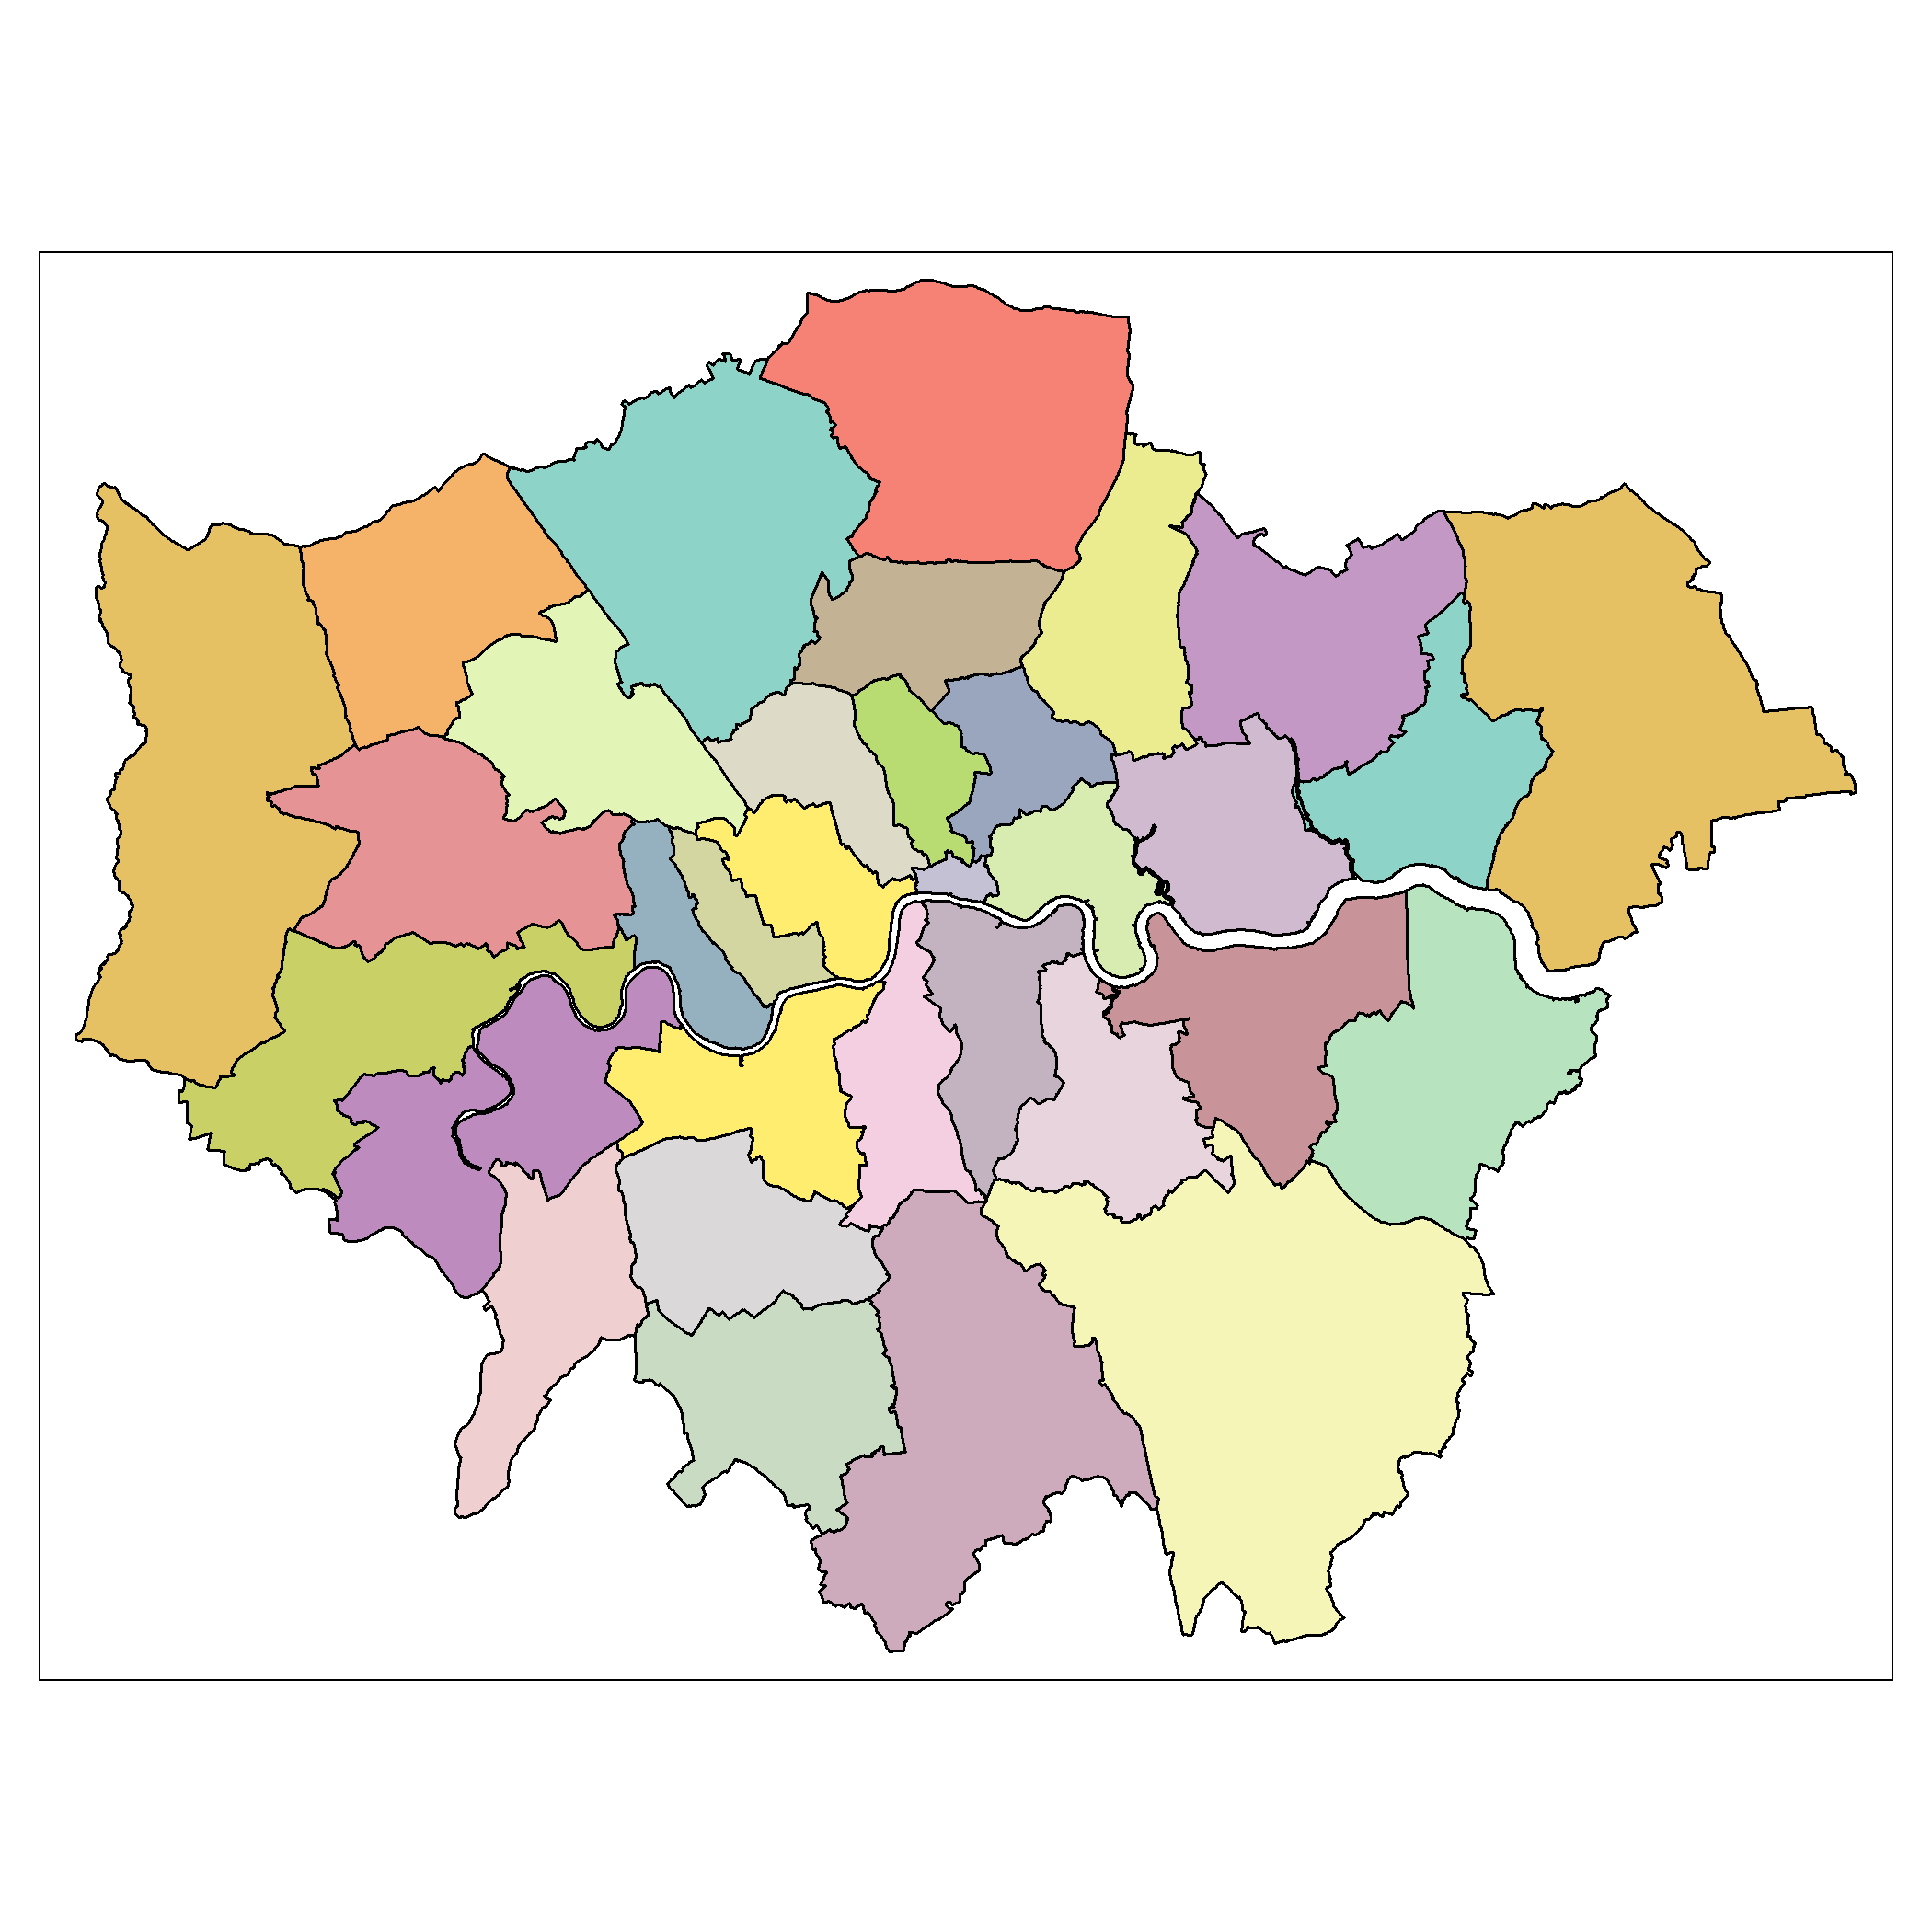
tmap Layers are in groups
Groups start with tm_shape(data = ...)
Groups are "connected" with a + sign as usual...
# Group 1tm_shape(lnd) + tm_borders(col = "black",lwd = 1) + tm_fill("NAME", legend.show = FALSE) +# Group 2 = Layer 2 tm_shape(cycle_hire_osm) + tm_symbols(size = 0.2, col = "red")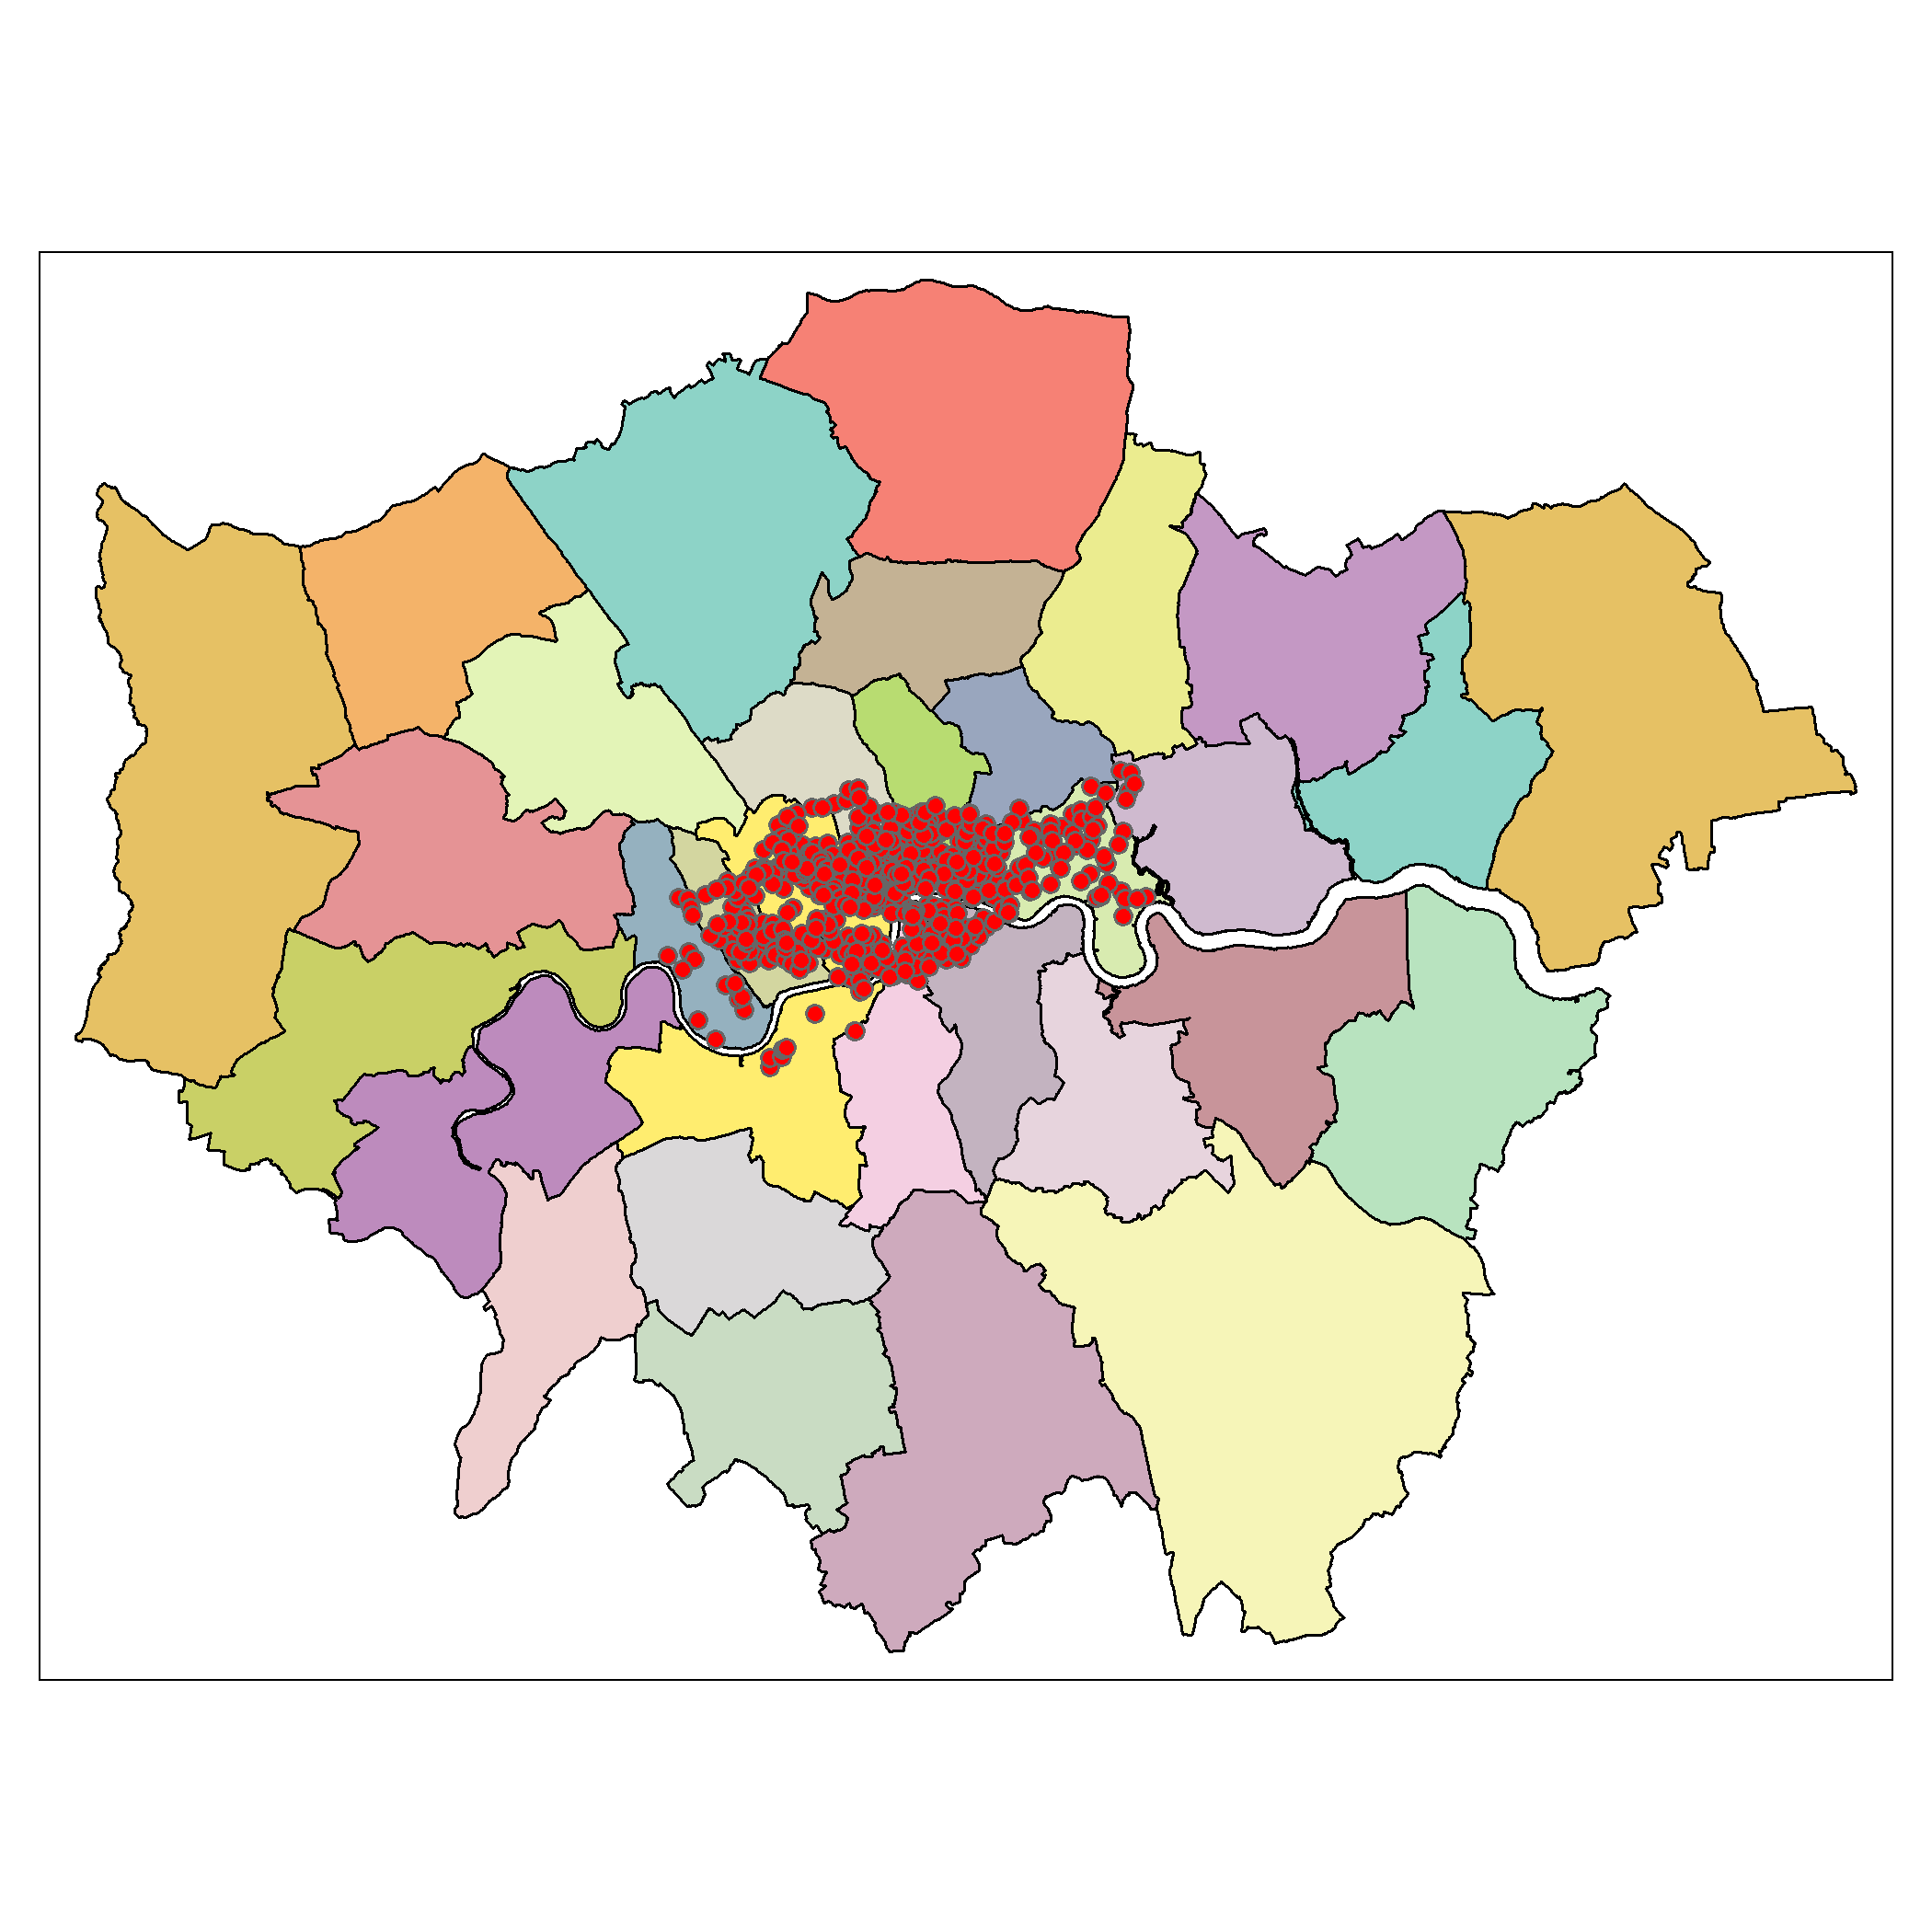
Add graticules and legends
# Group 1tm_shape(lnd) + tm_borders(col = "black",lwd = 1) + tm_fill("NAME", legend.show = FALSE) +# Group 2 = Layer 2 tm_shape(cycle_hire_osm) + tm_symbols(size = 0.2, col = "red") + tm_graticules() + tm_add_legend(type = "symbol", col = "red", title = "Hire Cycles Here")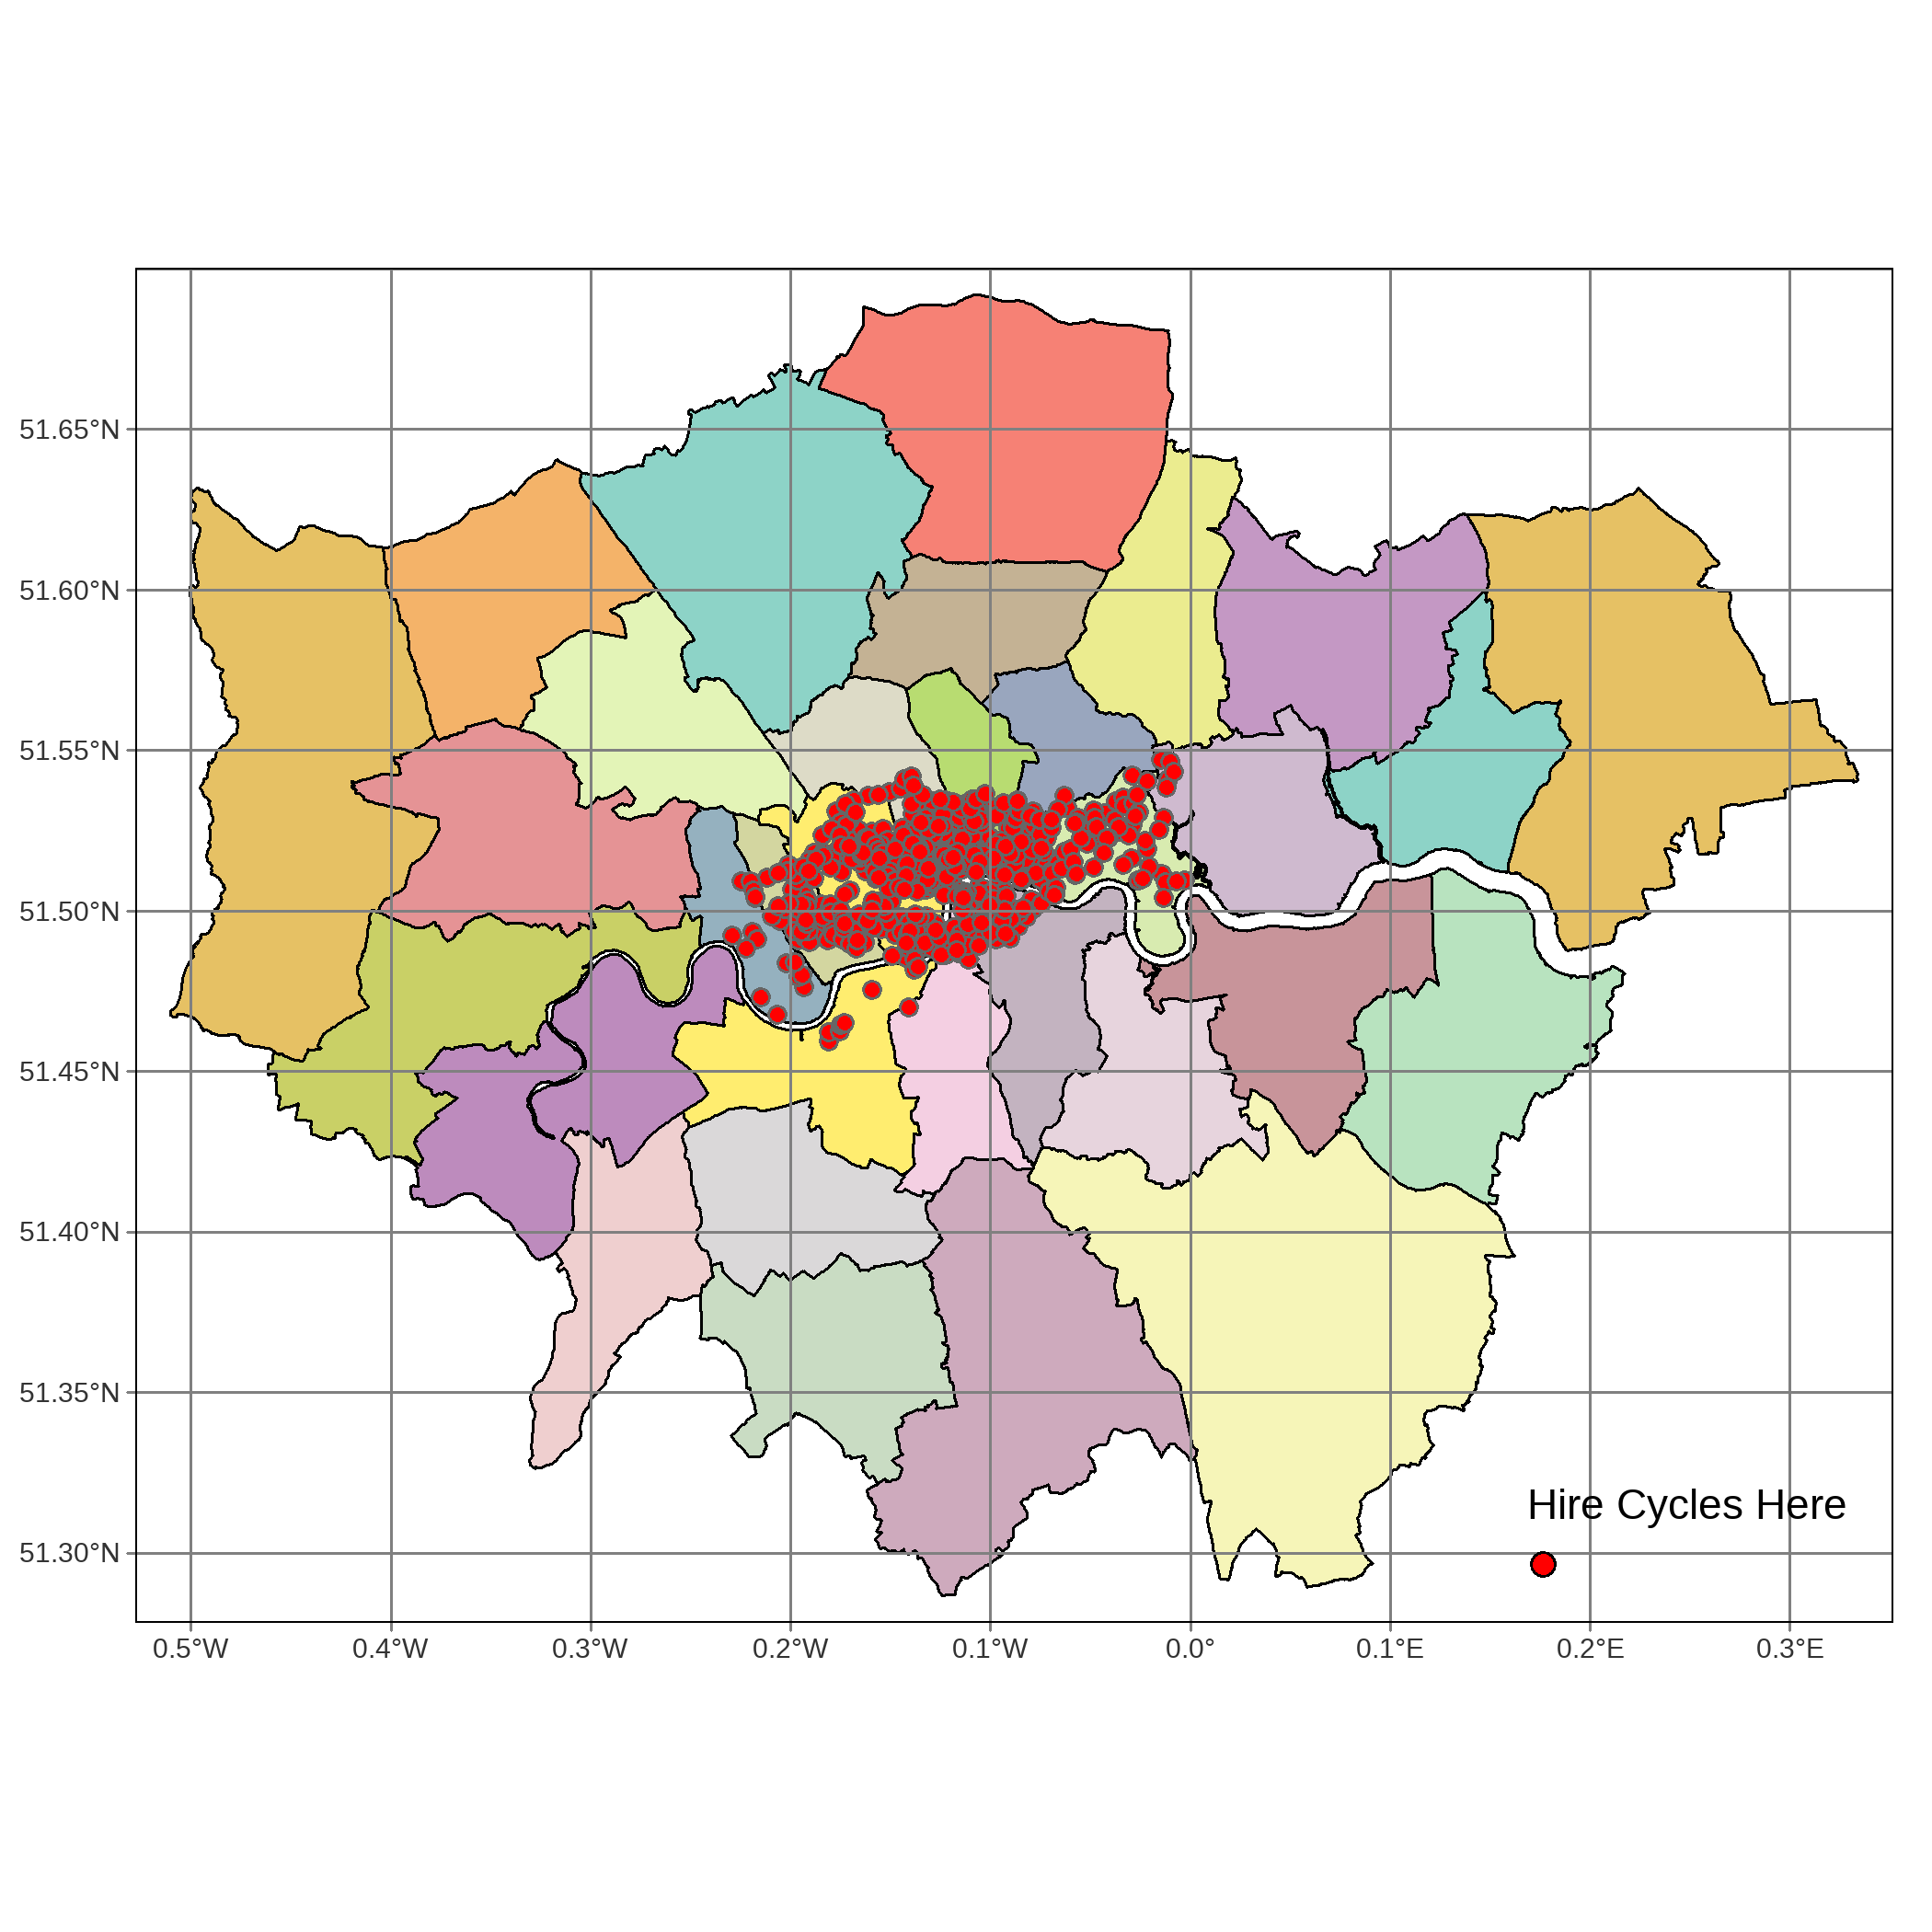
Add Scale and Compass to the Map
# Group 1tm_shape(lnd) + tm_borders(col = "black",lwd = 1) + tm_fill("NAME", legend.show = FALSE) +# Group 2 = Layer 2 tm_shape(cycle_hire_osm) + tm_symbols(size = 0.2, col = "red") + tm_graticules() + tm_add_legend(type = "symbol", col = "red", title = "Hire Cycles Here") + tm_scale_bar(position=c("left", "bottom"), text.size = 1) + tm_compass(position = c("right", "top"), type = "rose", size = 2)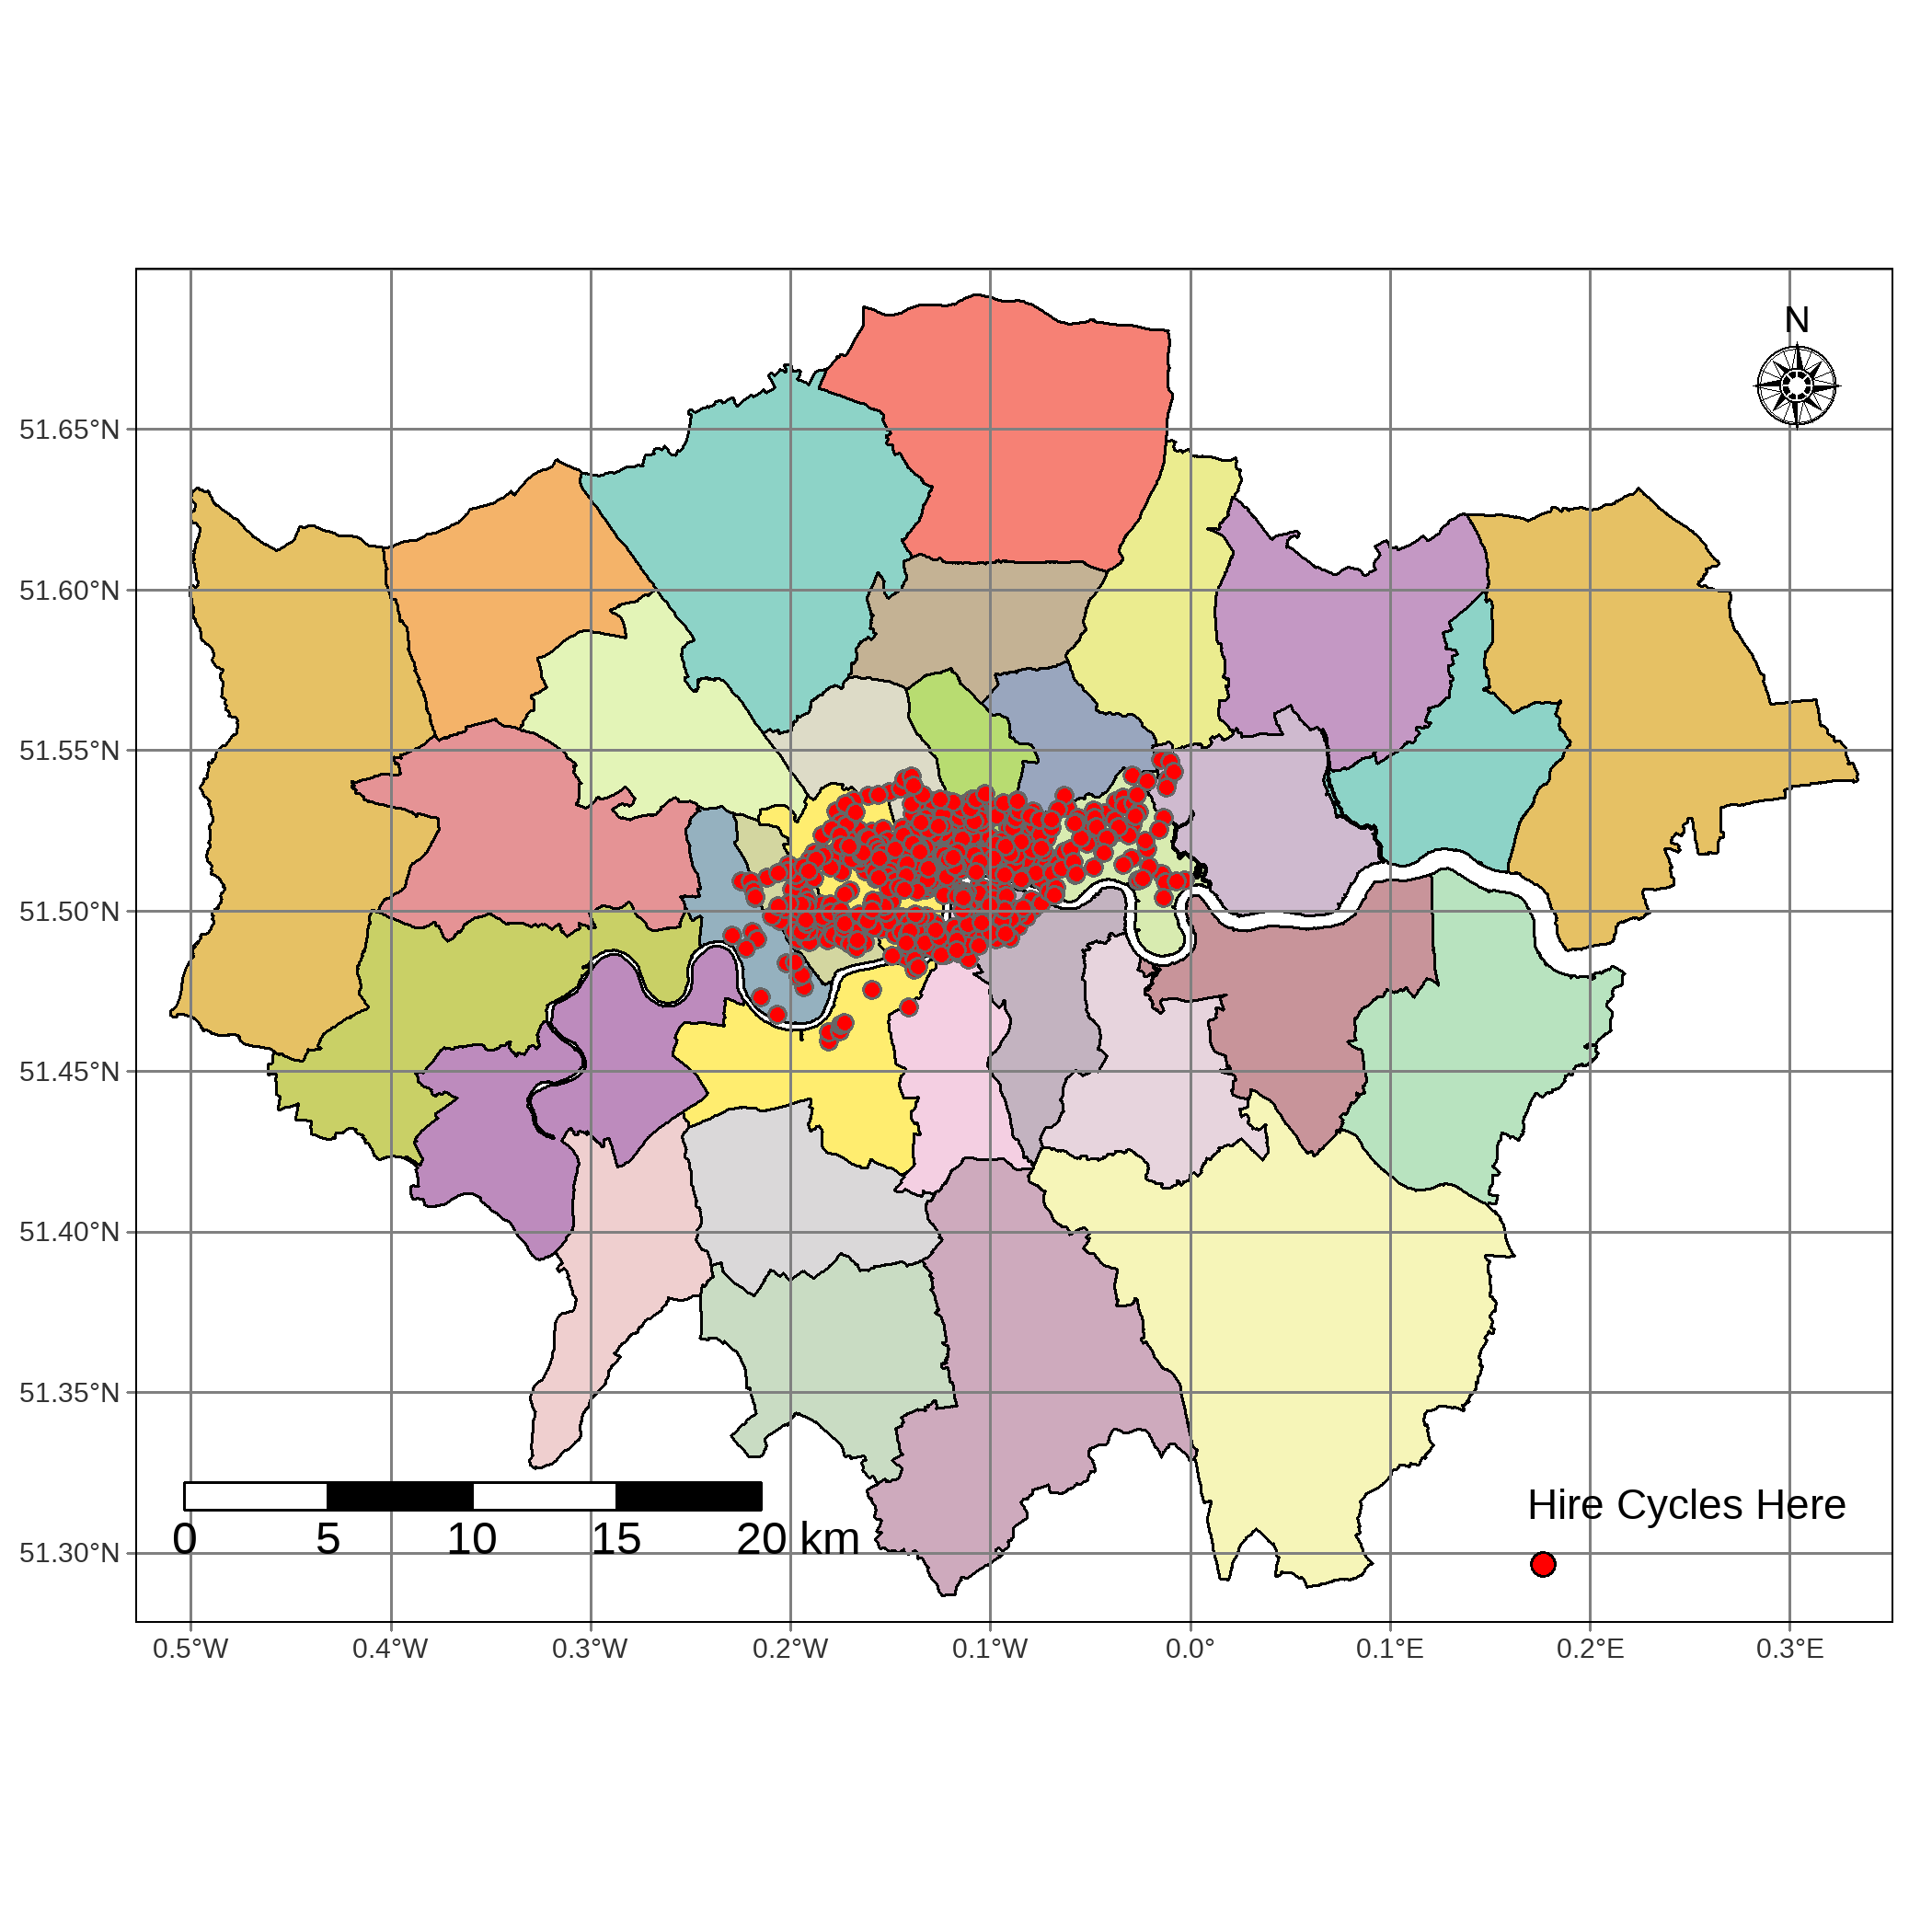
Add Credits and Layout Options
mymap <- tm_shape(lnd) + tm_borders(col = "black", lwd = 1) + tm_fill("NAME", legend.show = FALSE) +tm_shape(cycle_hire_osm) + tm_symbols(size = 0.2, col = "red") + tm_graticules() + tm_add_legend(type = "symbol", col = "red", title = "Hire Cycles Here") + tm_scale_bar(position=c("left", "bottom"),text.size = 1) + tm_compass(position = c("right", "top"), type = "rose", size = 2) + tm_credits(text = "Arvind V, 2021", position = c("left", "bottom")) + tm_layout(main.title = "London Bike Share", bg.color = "lightblue", inner.margins = c(0, 0, 0, 0))mymap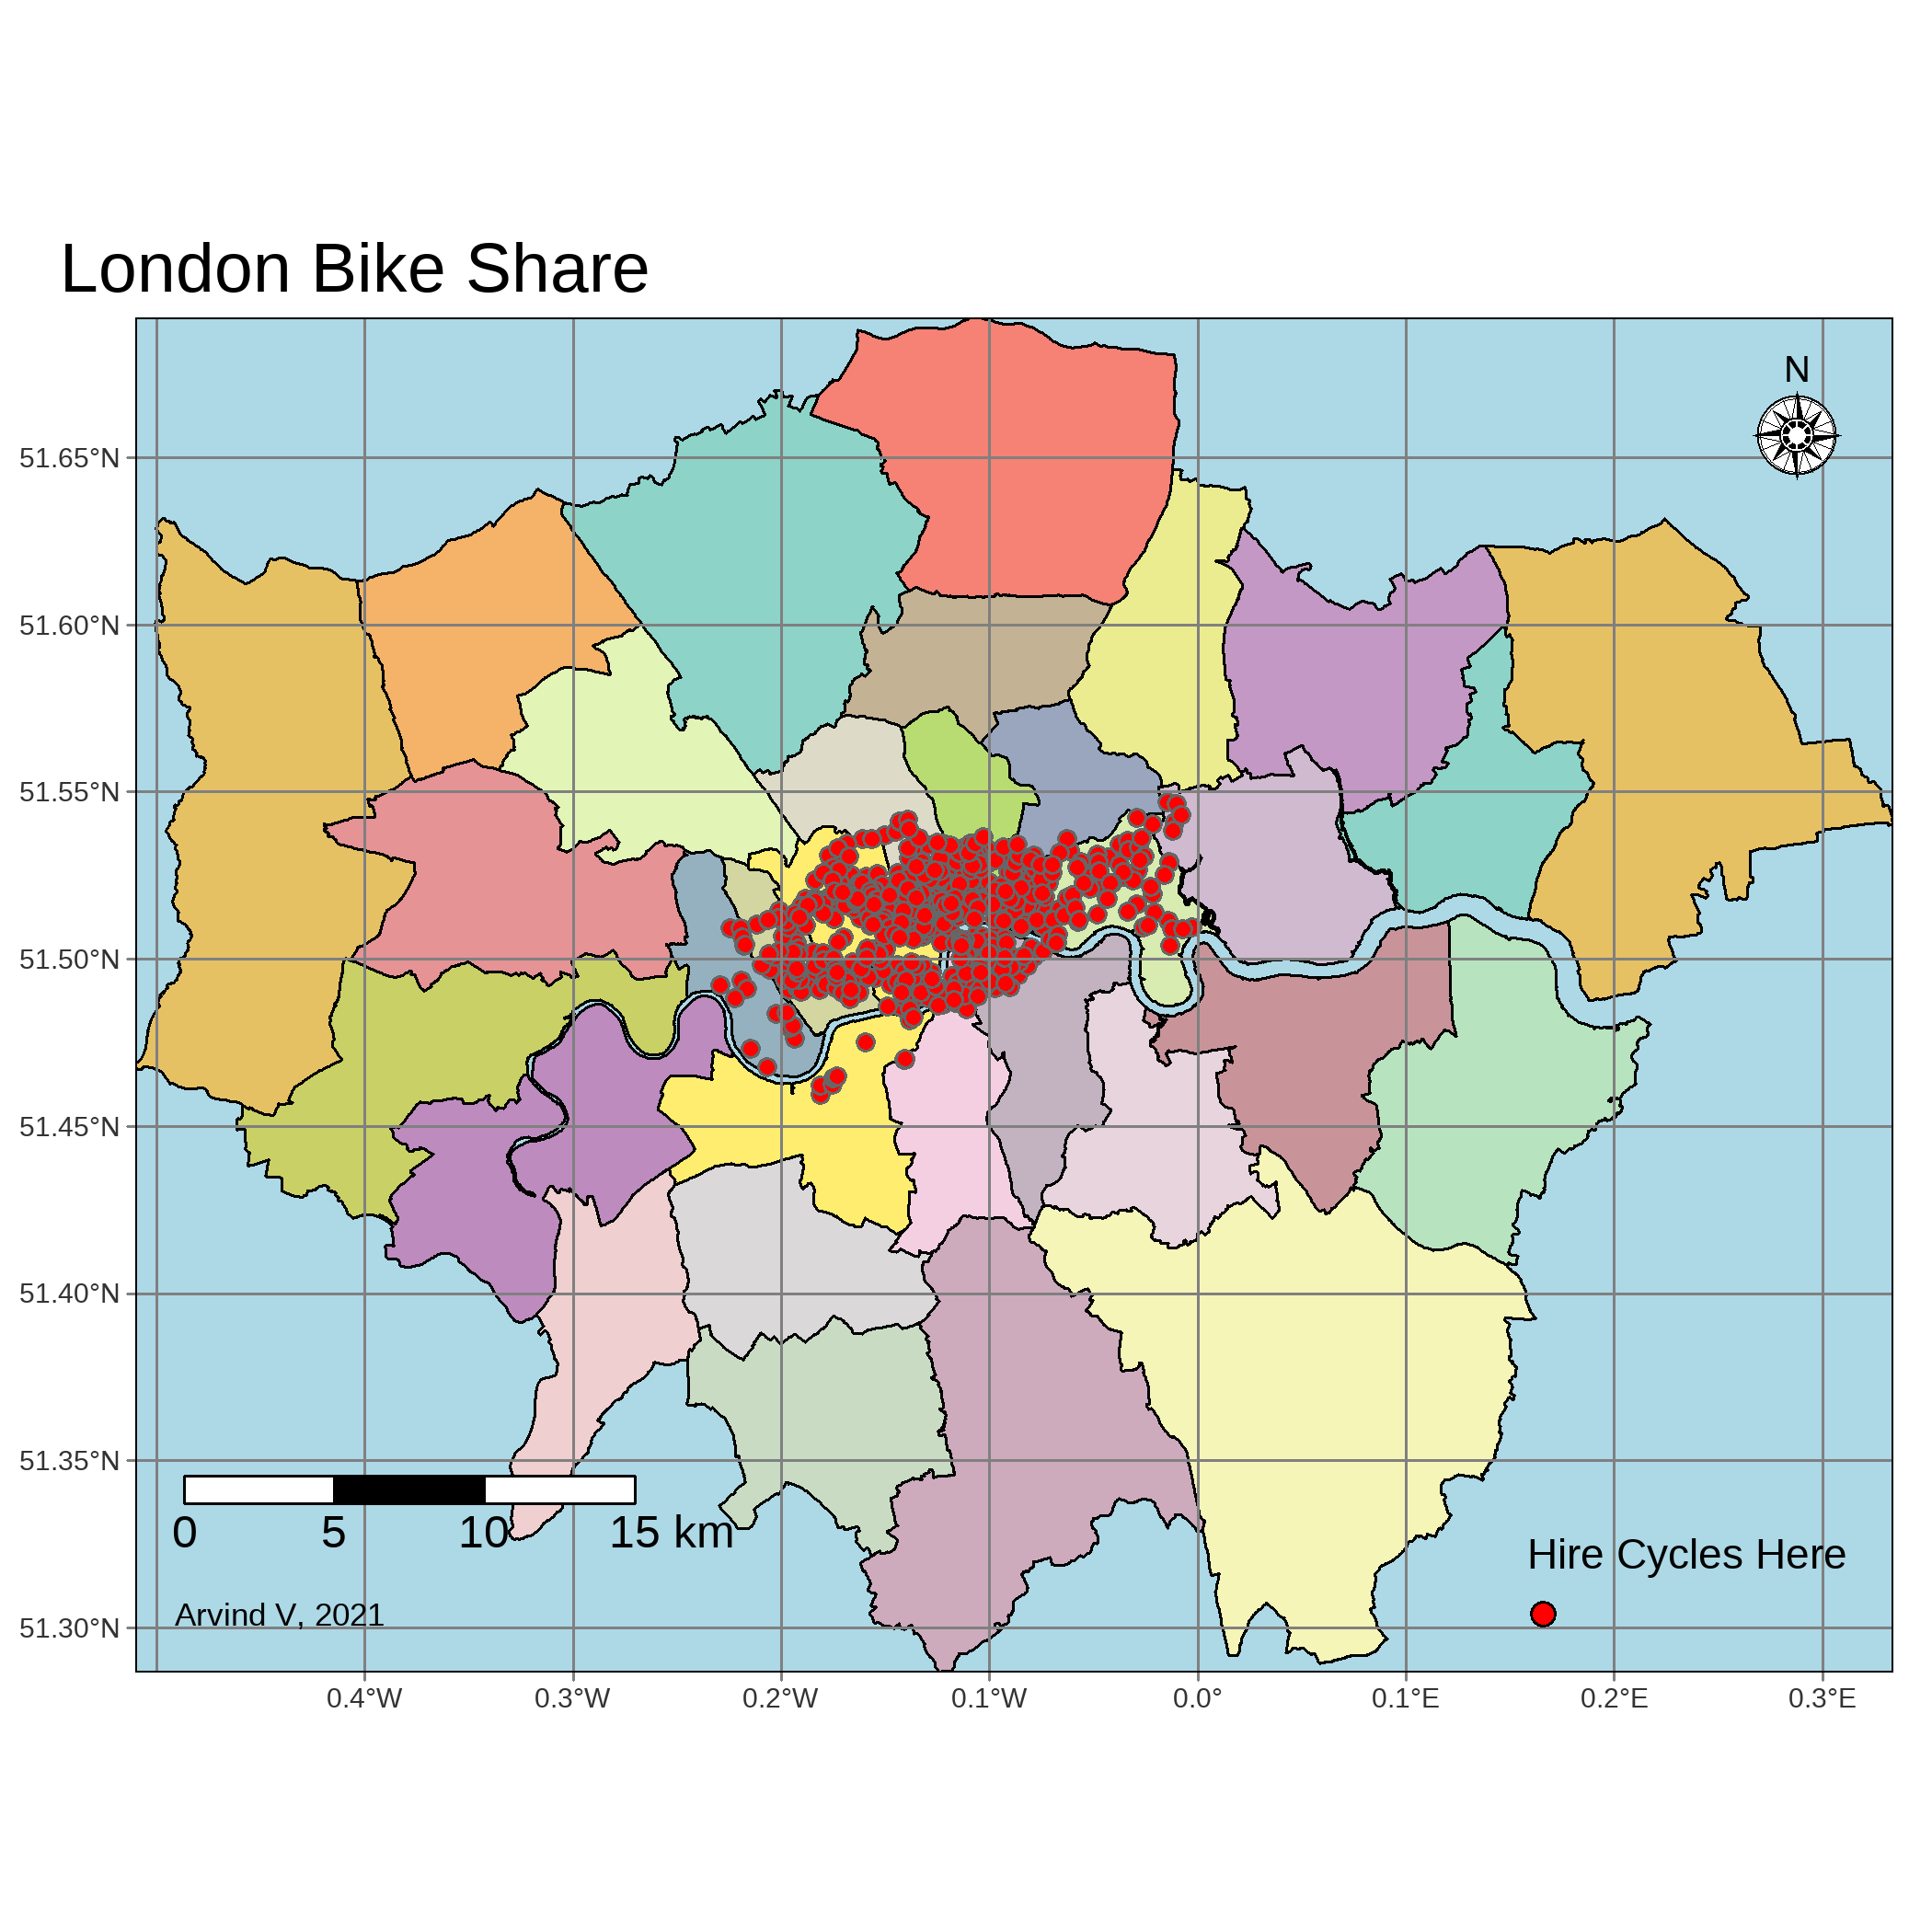
Saving
tmap_save(my_map, filename = "my_map.png", width = 300, height = 800, dpi = 300)